
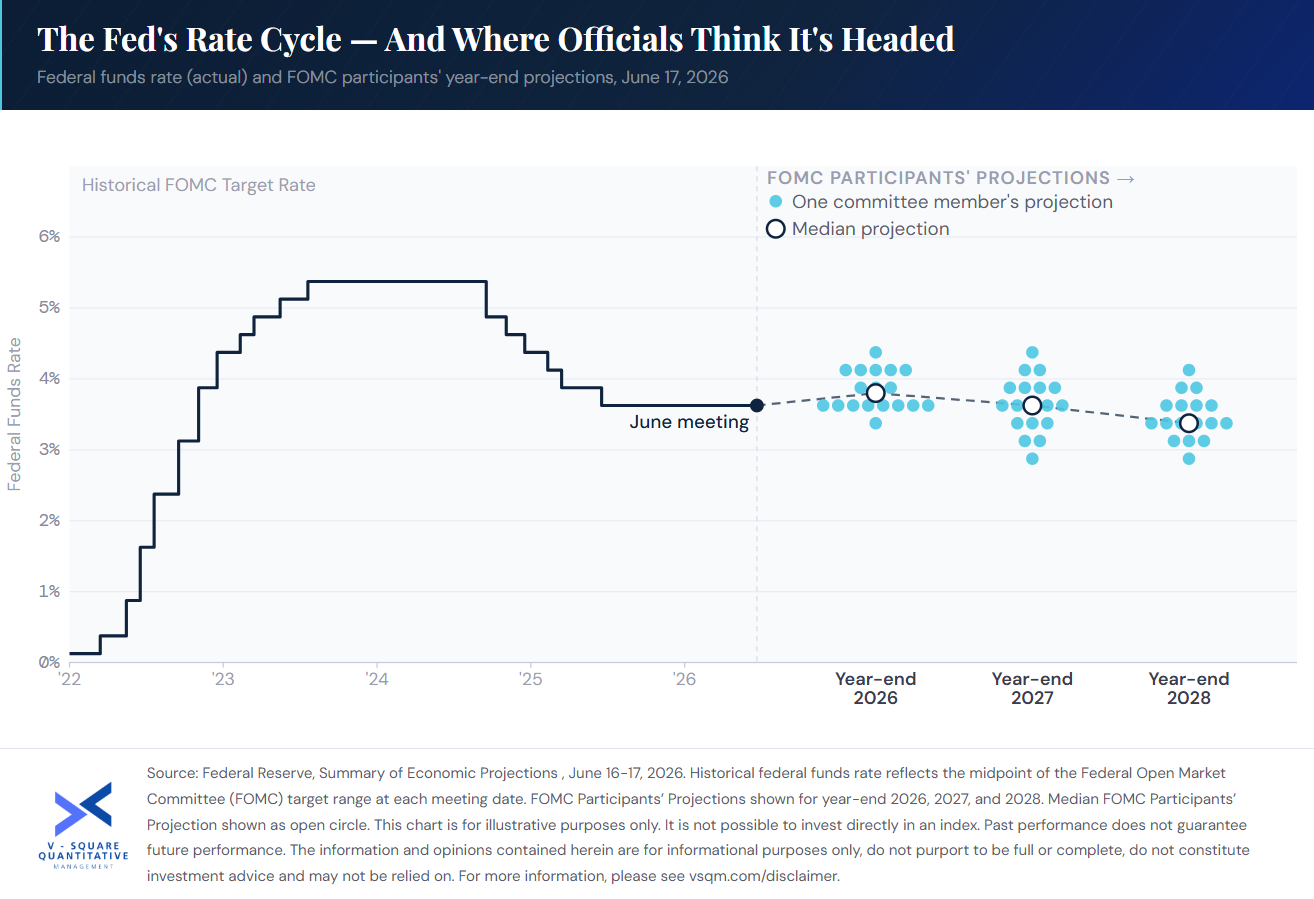
Kevin Warsh chaired his first Federal Open Market Committee (FOMC) meeting this week.
Notably, Warsh did not submit his own dot plot chart meaning that there was one less prediction than usual. Whilst we don’t know how his tenure as Fed Chair may evolve over time, not submitting a plot seems to indicate his intention to share less predictive data points with an aim of allowing the markets to price in adjustments, rather than the committee telegraphing forward guidance.
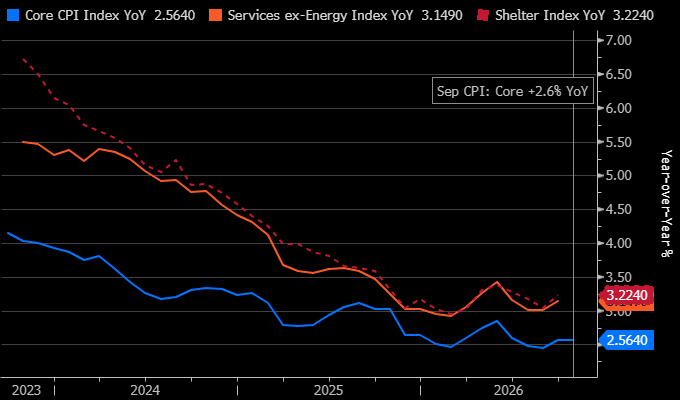
On the macro backdrop, the data is mixed. The labor market remains stable with employment at 4.3% (18 June 2026), yet both headline and core Consumer Price Index (CPI) continue to run above the long-term 2% target. CPI, driven in part by rising oil and gasoline prices, continues to weigh on American consumer strength.
In the March 2026 FOMC meeting, preceding Walsh, the committee projected rates holding or declining through year-end 2026. Today, roughly half of the submitted dot plot submissions project at least one rate increase before year-end, representing a meaningful shift in direction in a short period of time.
With inflation persistently above target, we continue to see value in inflation-sensitive allocations. We view listed infrastructure and listed natural resources as historically effective inflation hedges, with return drivers that are structurally distinct from traditional equity risk.
Furthermore, if the pattern of reduced forward guidance from the FOMC persists, investors may experience higher market volatility. Portfolios concentrated in equities may face a bumpier path. Diversifying exposures, rather than divesting completely from equities, could smoothen the path as investors move toward market-neutral strategies to reduce overall volatility.
How are you interpreting the impact of Fed changes on your portfolio?
Source: Federal Reserve, Summary of Economic Projections , meeting held June 16-17, 2026. Historical federal funds rate reflects the midpoint of the Federal Open Market Committee (FOMC) target range at each meeting date. FOMC Participants’ Projections shown for year-end 2026, 2027, and 2028. Median FOMC Participants’ Projection shown as open circle.
This chart is for illustrative purposes only. Other indexes are available. It is not possible to invest directly in an index. Index returns do not reflect any management fees, transaction costs or expenses. Past performance does not guarantee future performance. The information and opinions contained herein are for informational purposes only, do not purport to be full or complete, do not constitute investment advice and may not be relied on. For more information, please see vsqm.com/disclaimer.