
Headline inflation was +4.2% year-on-year (YoY)according to the Bureau of Labor Statistics’ May 2026 report. This is the highest YoY consumer price index number in three years, and it will likely lead the story heading into the Fed’s upcoming meeting on June 16, 2026.
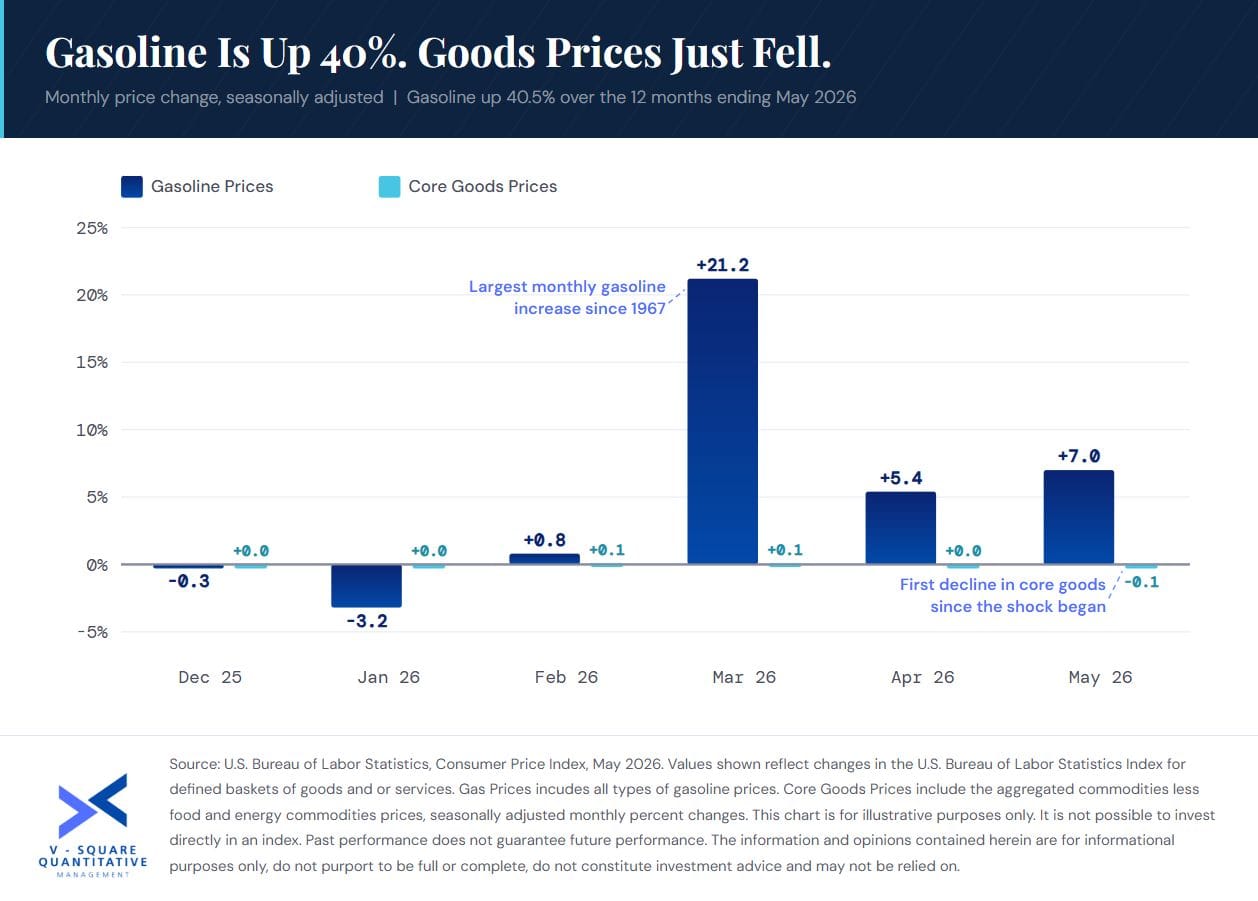
Just as interestingly, core goods (commodities less food and energy commodities) prices fell 0.1% in May.
Looking into the report further, we see that gas prices are +40.5% higher than a year ago. With such elevated gas costs, one would expect transportation costs to show up in increased retail prices. Instead, goods inflation has been close to zero since December 2025 and, it turned negative in May 2026. This implies that fuel costs are currently visible in markets with a captive buyer such as in airline fare fees which are up 26.7% over the past 12 months.
Last week the savings data portrayed a consumer with less discretionary funds than the spending data implied. Retailers, despite facing a 40% fuel increase, are holding prices stable where possible as consumer demand is likely to have little room for growth.
Ahead of the Fed meeting, we believe that the risk worth modeling is a real income squeeze compounding into a growth problem while attention stays fixed on gas prices.
For portfolios, what is driving inflation matters. Natural resources producers benefit directly from the increase in gas prices. We view quality and dividend yield as well-positioned to hold ground when households retrench. In a systematic approach, those exposures are set by design, before the economic data arrives. We believe that investors deciding this week whether to buy an inflation hedge after the inflation has already printed is making that same decision, only at prices that have now adjusted.
Source: U.S. Bureau of Labor Statistics, Consumer Price Index, May 2026. Values shown reflect changes in the U.S. Bureau of Labor Statistics Index for defined baskets of goods and or services. Gas Prices incudes all types of gasoline prices. Core Goods Prices include the aggregated commodities less food and energy commodities prices, seasonally adjusted monthly percent changes.
This chart is for illustrative purposes only. Other indexes are available. It is not possible to invest directly in an index. Index returns do not reflect any management fees, transaction costs or expenses. Past performance does not guarantee future performance. The information and opinions contained herein are for informational purposes only, do not purport to be full or complete, do not constitute investment advice and may not be relied on. For more information, please see vsqm.com/disclaimer.