
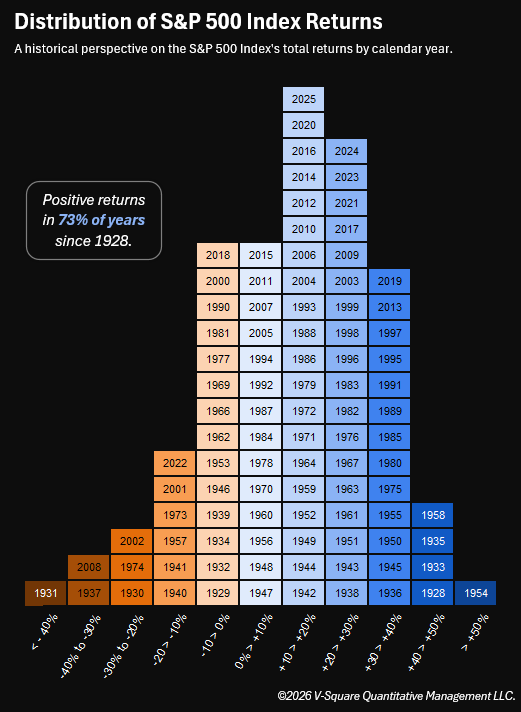
In 2026 equities have delivered an eventful ride, with volatility picking up in recent weeks amid geopolitical tensions. As at 3/11/2026, the S&P 500 Index return is roughly -0.8% year to date, a modest pullback that can still feel uncomfortable for many investors.
Though past performance isn’t indicative of future performance, that near term discomfort looks different when you place it against nearly a century of data.
Since 1928, the S&P 500 Index has finished positive in roughly three out of every four calendar years, with many of those years delivering double digit gains. Periods of stress and drawdowns are a recurring feature of that history, not a bug. Both 2002 and 2008 remain vivid reminders that equity markets can and do experience meaningful setbacks.
Yet over longer horizons, the cumulative effect of staying invested through those difficult periods has historically been powerful for long term wealth creation.
To us, this underscores two key principles:
- Remain invested: Trying to sidestep every bout of volatility can mean missing a small number of very strong recovery periods that could drive long term returns.
- Diversify intelligently: Equities have offered compelling long term total returns, but a resilient portfolio rarely relies on a single asset class. High quality bonds, real assets, and commodities can help dampen volatility and potentially improve risk adjusted outcomes over a full annual cycle.
In other words, the question is often less “Should I be in or out?” and more “Is my total portfolio aligned with my tolerance for drawdowns and my time horizon?”
How are you thinking about diversification and risk today? Have you made changes to your equity, fixed income, or real asset exposures in response to recent volatility?
We’d be interested to hear how you’re positioning portfolios at this stage of the cycle.
Source: Bloomberg, V-Square Quantitative Management LLC, S&P Global. The chart displays the distribution of total returns for the S&P 500 Index, for calendar years from 1928 to 2025. Other indexes are available.
This chart is for illustrative purposes only. Other indexes are available. It is not possible to invest directly in an index. Index returns do not reflect any management fees, transaction costs or expenses. Past performance does not guarantee future performance. The information and opinions contained herein are for informational purposes only, do not purport to be full or complete, do not constitute investment advice and may not be relied on. For more information, please see vsqm.com/disclaimer.