
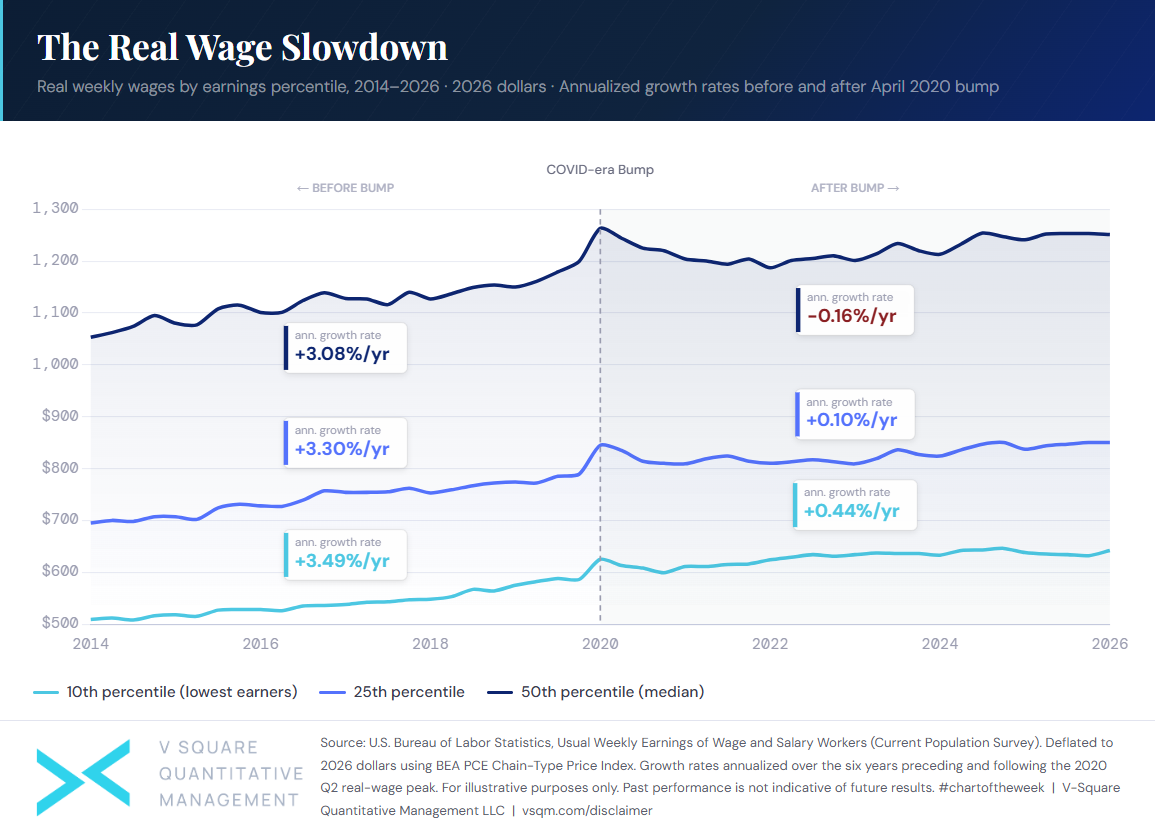
Real wage growth can provide useful insight into the American household and the strength of our economy. Taking a step beyond nominal wage numbers, real wages are adjusted for inflation and show purchasing power.
In the years leading up to the COVID-19 crisis of 2020, and shortly following, the US saw strong real wage growth, particularly at the lower end of the labor market. Over the past six years that growth has slowed, with the median worker displaying negative real wage growth. While this trend towards negative real wage growth can partly be attributed to the temporary increase in COVID-related layoffs, it has persisted.
What stands out to us most is how broad-based the slowdown has been in recent years; rather than being concentrated at a single point of the income distribution level, real wage growth has stagnated across the board.
This trend impacts lower-income workers the most. They typically have less cushion, as a larger share of income goes to core expenses with less income from investments or savings. This impact can be seen in other economic data as well; personal savings rates currently sits well-below the 8.4% long-run average at approximately 2.7%.
From an investment perspective, we believe this dynamic is worth watching. In our view, broad consumer exposures could face headwinds looking forward as they potentially experience less spending power due to less personal savings. We believe investors should focus on company quality and systematic, factor-aware approaches that can provide diversified exposures beyond consumer-oriented sectors.
Source: U.S. Bureau of Labor Statistics, Usual Weekly Earnings of Wage and Salary Workers (Current Population Survey). A real wage is defined as income after it is adjusted for inflation. Deflated to 2026 dollars using BEA PCE Chain-Type Price Index. Growth rates annualized over the six years preceding and following the 2020 Q2 real-wage peak. For illustrative purposes only. Past performance is not indicative of future results. It is not possible to invest directly in an index.
This chart is for illustrative purposes only. Other indexes are available. It is not possible to invest directly in an index. Index returns do not reflect any management fees, transaction costs or expenses. Past performance does not guarantee future performance. The information and opinions contained herein are for informational purposes only, do not purport to be full or complete, do not constitute investment advice and may not be relied on. For more information, please see vsqm.com/disclaimer.