
I certainly remember where I was on September 25, 2016. It was just a few days before the birth of my twin girls.
Do I remember that the US Small Cap and Natural Resources asset classes were having a great year? Of course.
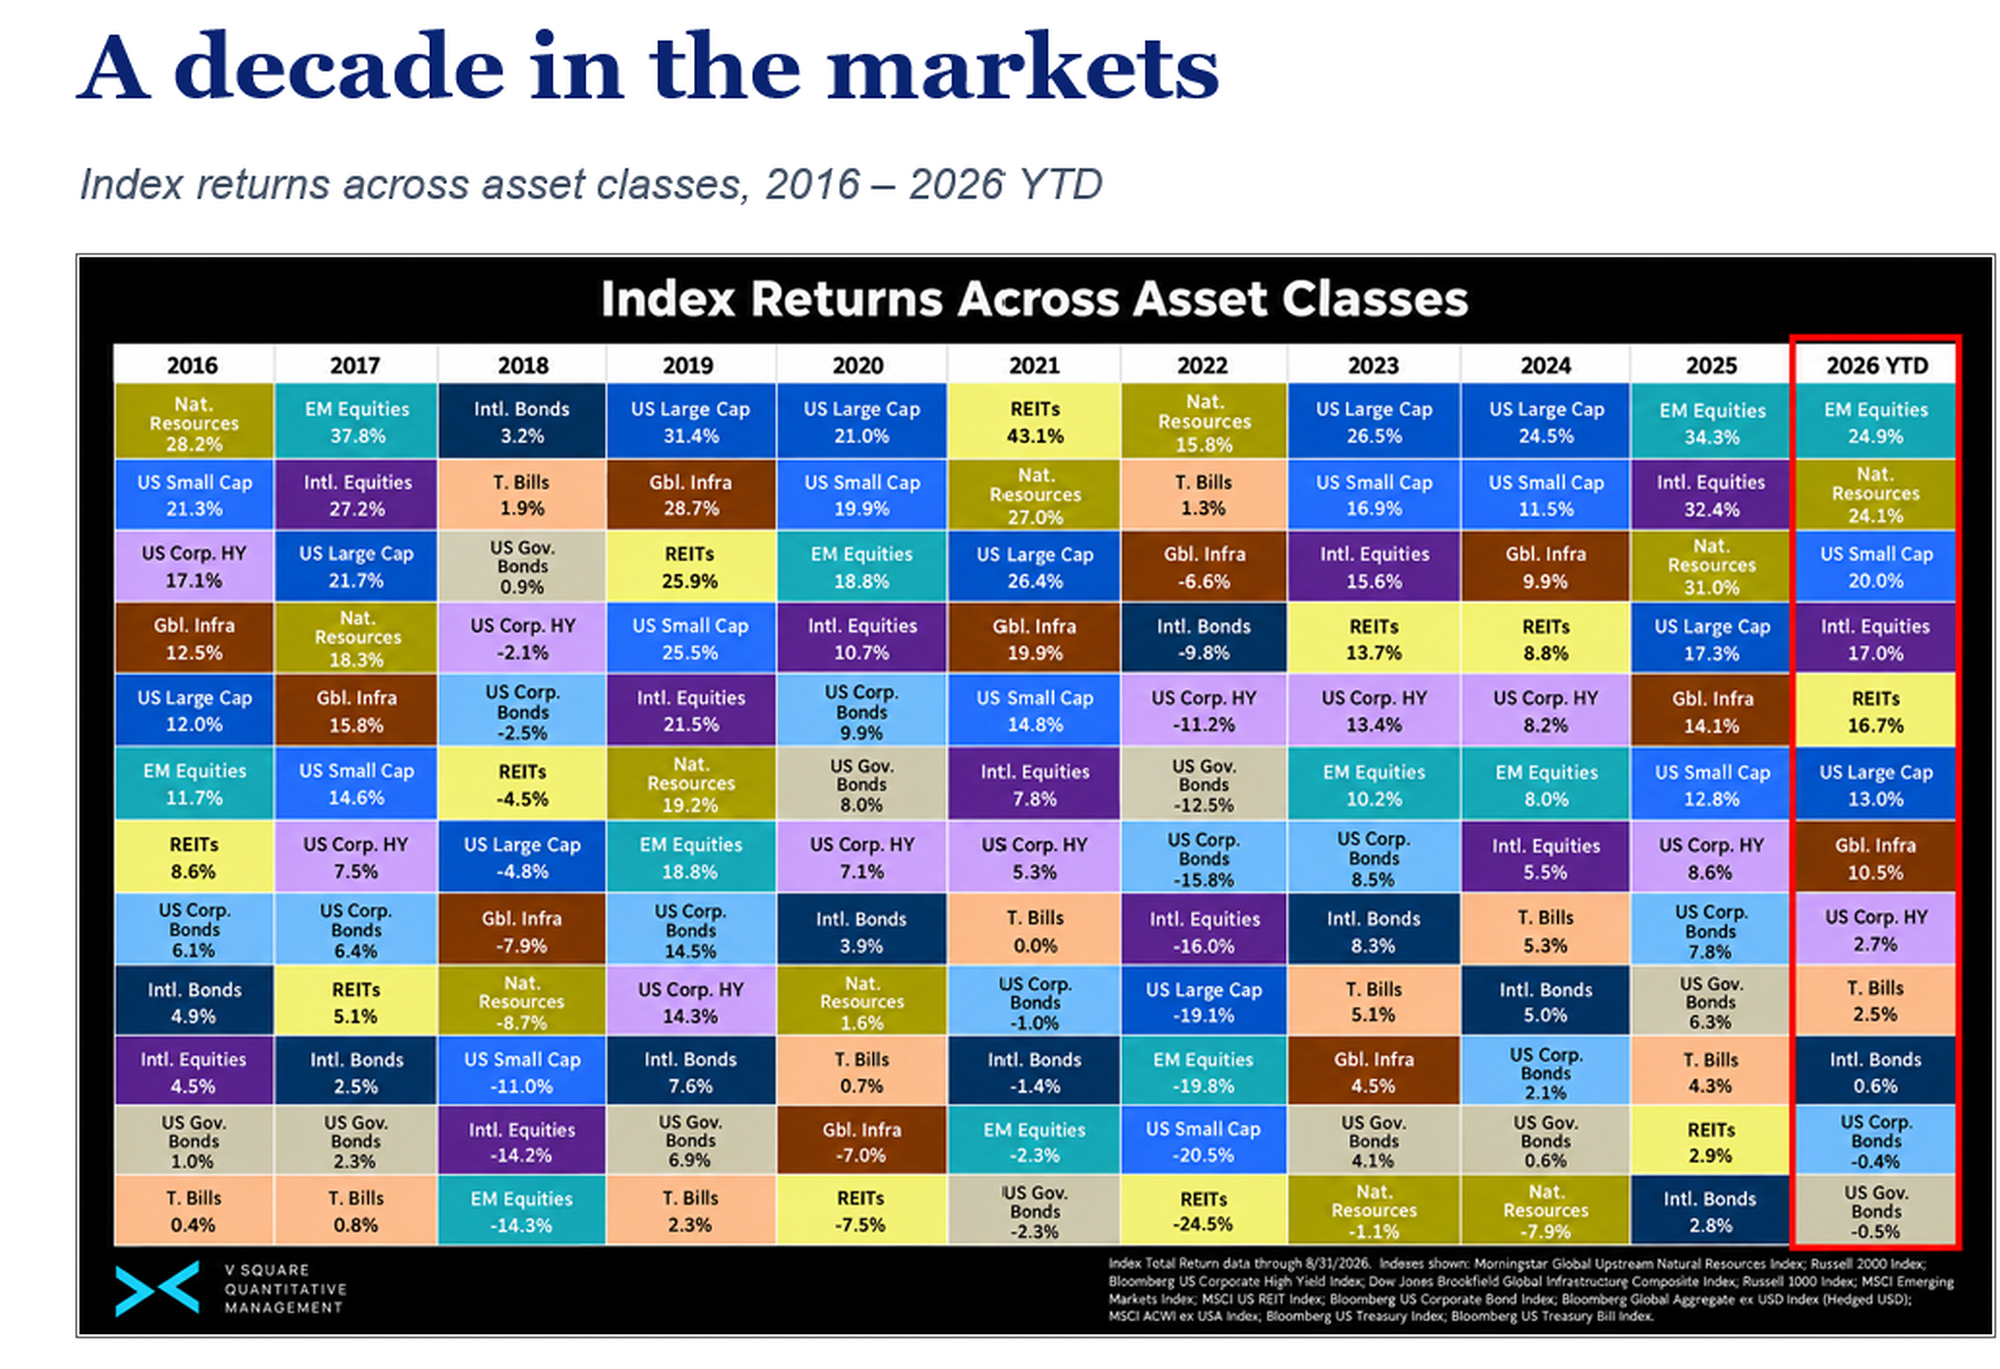
Looking back ten years later, I ask us to all consider why leadership keeps changing. Our chart and this discussion illustrates these changes and asset class leadership, as represented by market indexes.
As professional investors and systematic managers, we see market leadership as the result of a constantly changing mix of valuations, growth, inflation, interest rates, liquidity, geopolitics, sector fundamentals, factor cyclicality, investor behavior, and a bit of je ne sais quoi.
Occasionally, something arrives that almost nobody had in the model, like COVID.
Valuations and positioning shape the opportunity set. US Large Cap led in 2019 (+31.4%), remained strong in 2020 (+21.0%), and returned to the top in 2023 (+26.5%) and 2024 (+24.5%). Returns on an equity index come from income, earnings growth and changes in the valuation multiple. What the record suggests to me is that a higher starting valuation multiple leaves less room for re-rating and puts more of the burden on earnings, and that crowded positioning lowers the bar for what it takes to move a sector to the leader position. Long stretches of outperformance can make leadership feel permanent. It rarely is.
Macro regimes can completely reshuffle the table. In 2022, with inflation elevated and rates repricing, Natural Resources returned +15.8%, while US Large Cap fell 19.1%, Emerging Markets Equity fell 19.8% and REITs fell 24.5%. The economic backdrop supporting long-duration equities differs materially from one that rewards commodities, real assets or cash.
Geopolitics can move quickly from headlines into prices. We are seeing that transmission in real time. Vessel traffic through the Strait of Hormuz remains well below pre-conflict levels, while pressure across key Middle East shipping routes has raised transportation and tanker costs. The effects can move through energy, freight, inflation expectations and, ultimately, financial conditions.
The asset-class leaderboard is also a map of factor rotation. Size is the easiest example to see: US Small Cap returned +21.3% in 2016 and +19.9% in 2020, while US Large Cap led in 2019 (+31.4%), 2023 (+26.5%) and 2024 (+24.5%). Beneath those asset-class outcomes sit factor regimes shaped by momentum, value, quality, growth, size, profitability, yield and volatility. Recent US large-cap leadership carried strong momentum, growth and quality characteristics, reinforced by scale, profitability and AI-related concentration. Other regimes have rewarded value, smaller companies, income and lower-volatility exposures. Factor premiums are cyclical, and leadership shifts as valuations, earnings, rates, liquidity and investor positioning change. For systematic investors, understanding those embedded exposures is central to portfolio construction.
Behavior amplifies the cycle. Investors naturally extrapolate what has just worked. Recency bias, FOMO (fear of missing out) and crowded positioning can keep capital flowing toward yesterday’s winner, sometimes just as leadership begins to broaden or reverse.
Then come the events almost nobody modeled. COVID is the clearest example of the last decade. By year-end 2020, US Large Cap returned +21.0%, US Small Cap returned +19.9% and Emerging Markets Equity returned +18.8%. The shock was extraordinary, as were the policy response and subsequent recovery. Markets can respond in ways that prove as difficult to anticipate as the events themselves.
As of August 31, 2026, leadership has shifted again. Emerging Market Equities (+24.9%) and Natural Resources (+24.1%) lead, while US Large Cap (+13.0%) sits closer to the middle. US Corporate Bonds (-0.4%) and US Government Bonds (-0.5%) are slightly negative.
Our view: build portfolios across genuinely different sources of risk and return, because the forces driving market leadership keep changing.
Ten years later, that may be the most durable lesson in the chart: You cannot know which asset class will lead next. But you can build a portfolio that does not require you to know.
Source: Index total return data between August 31, 2015 and August 31, 2026. Indexes shown to represent asset classes: Morningstar Global Upstream Natural Resources Index representing Natural Resources; Russell 2000 Index representing US Small Cap; Bloomberg US Corporate High Yield Index representing US Corp. Bonds; Dow Jones Brookfield Global Infrastructure Composite Index representing Global Infrastructure; Russell 1000 Index representing US Large Cap; MSCI Emerging Markets Index representing Emerging Markets Equities; MSCI US REIT Index representing REITs; Bloomberg US Corporate Bond Index representing US Corporate Bonds; Bloomberg Global Aggregate ex USD Index (Hedged USD) representing International Bonds; MSCI ACWI ex USA Index representing International Equities; Bloomberg US Treasury Index representing US Government Bonds; Bloomberg US Treasury Bill Index representing T. Bills. For illustrative purposes only. It is not possible to invest directly in an index. Past performance is not indicative of future results.
This chart is for illustrative purposes only. Other indexes are available. It is not possible to invest directly in an index. Index returns do not reflect any management fees, transaction costs or expenses. Past performance does not guarantee future performance. The information and opinions contained herein are for informational purposes only, do not purport to be full or complete, do not constitute investment advice and may not be relied on. For more information, please see vsqm.com/disclaimer.