
The Federal Reserve raised its target range by 25 basis points this week, bringing the midpoint of the federal funds target range to 3.875%. Though the headline move was modest, we believe that this signifies a broader change in the policy backdrop.
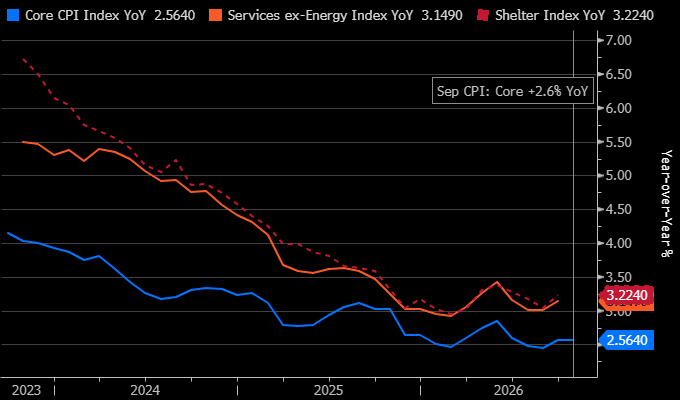
Core CPI peaked at 3.2% year over year in April 2026, and declined to 2.4% in August 2026. Over the same period, the midpoint of the federal funds target range increased from 3.625% to 3.875%.
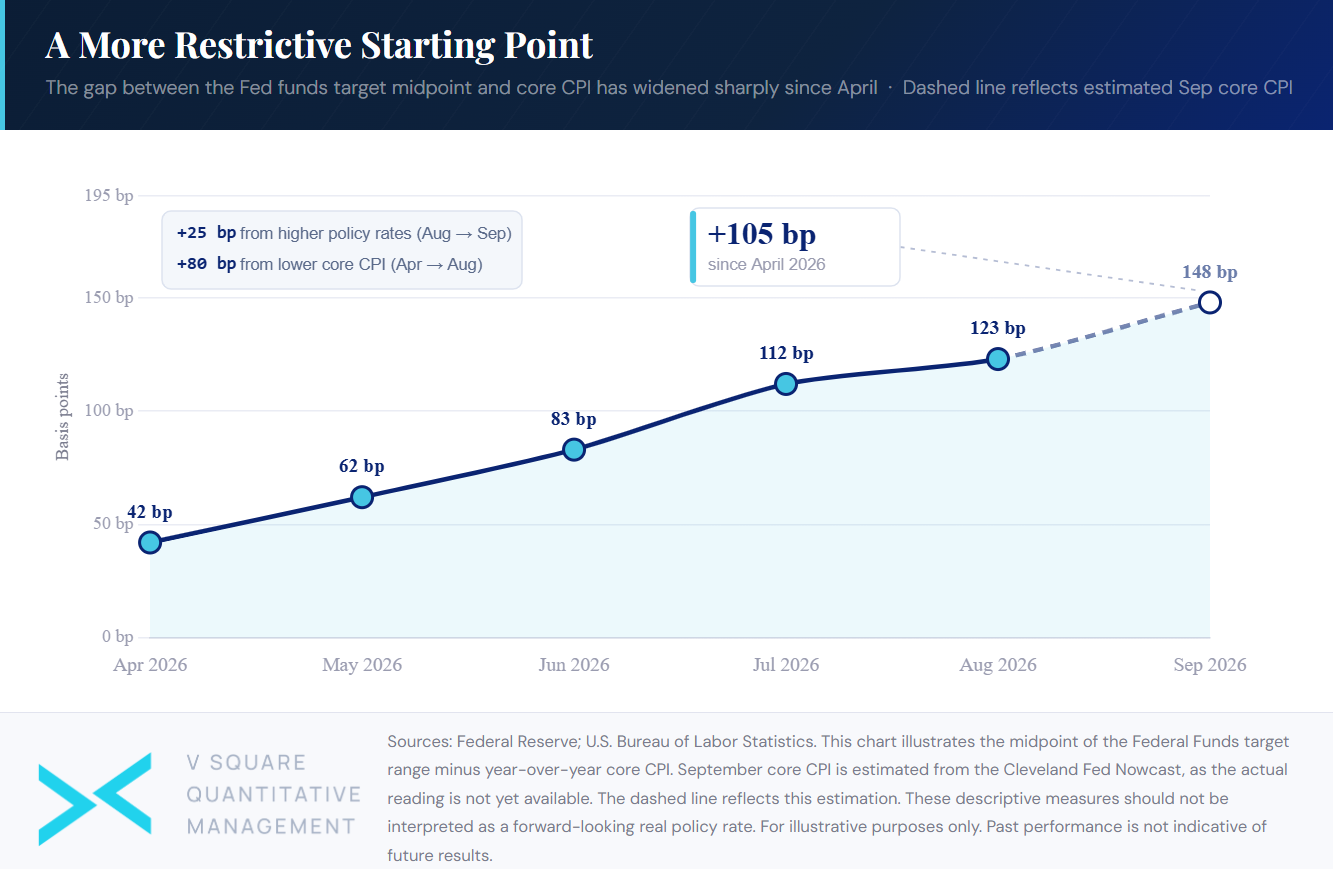
As a simple measure of the relationship between nominal policy rates and realized inflation, difference between Core CPI and the federal funds target rate midpoint has widened by approximately 105 basis points since April of 2026.
This difference between the current rate target and core CPI does not represent a forward-looking real policy rate. Inflation expectations, rather than realized CPI, are the more appropriate measure for evaluating a forward-looking real policy rate. However, the difference does illustrate an important feature of the current environment: monetary conditions can become more restrictive as inflation moderates even without a large increase in nominal policy rates.
The September Summary of Economic Projections add another dimension as the median FOMC participant projects a federal funds rate of 4.1% at 2026 year-end, suggesting that policymakers see some additional tightening from today's level by the end of the year.
For investors, the implication of tightening monetary policy extends beyond forecasting the next Fed meeting. Higher real and nominal discount rates increase the importance of cash-flow durability, financing costs and balance-sheet quality. These characteristics can also create greater dispersion across companies whose valuations, leverage and earnings profiles respond differently to the cost of capital.
For systematic investors, that dispersion matters. Rather than treating the rate environment as a single directional call, portfolios can be evaluated across multiple dimensions, including valuation, quality, profitability, duration sensitivity and leverage.
Though a 25-basis-point move received the attention this week, we believe that the more pertinent question for investors may be how much the underlying opportunity set changes for their portfolio as policy remains restrictive while inflation evolves.
Sources: Federal Reserve; U.S. Bureau of Labor Statistics. This chart illustrates the midpoint of the Federal Funds target range minus year-over-year core Consumer Price Index (CPI). September core CPI is estimated from the Cleveland Fed Nowcast, as the actual reading is not yet available. The dashed line reflects this estimation. These descriptive measures should not be interpreted as a forward-looking real policy rate. For illustrative purposes only. Past performance is not indicative of future results.
This chart is for illustrative purposes only. Other indexes are available. It is not possible to invest directly in an index. Index returns do not reflect any management fees, transaction costs or expenses. Past performance does not guarantee future performance. The information and opinions contained herein are for informational purposes only, do not purport to be full or complete, do not constitute investment advice and may not be relied on. For more information, please see vsqm.com/disclaimer.