
The Russell 2500 Index has gained 21.0% year to date, compared with a 13.1% gain for the S&P 500 Index. After years of large-cap leadership, Small-Mid Cap (SMID) is back in focus.
The strategic case for an allocation to SMID, however, is broader than this year's performance.
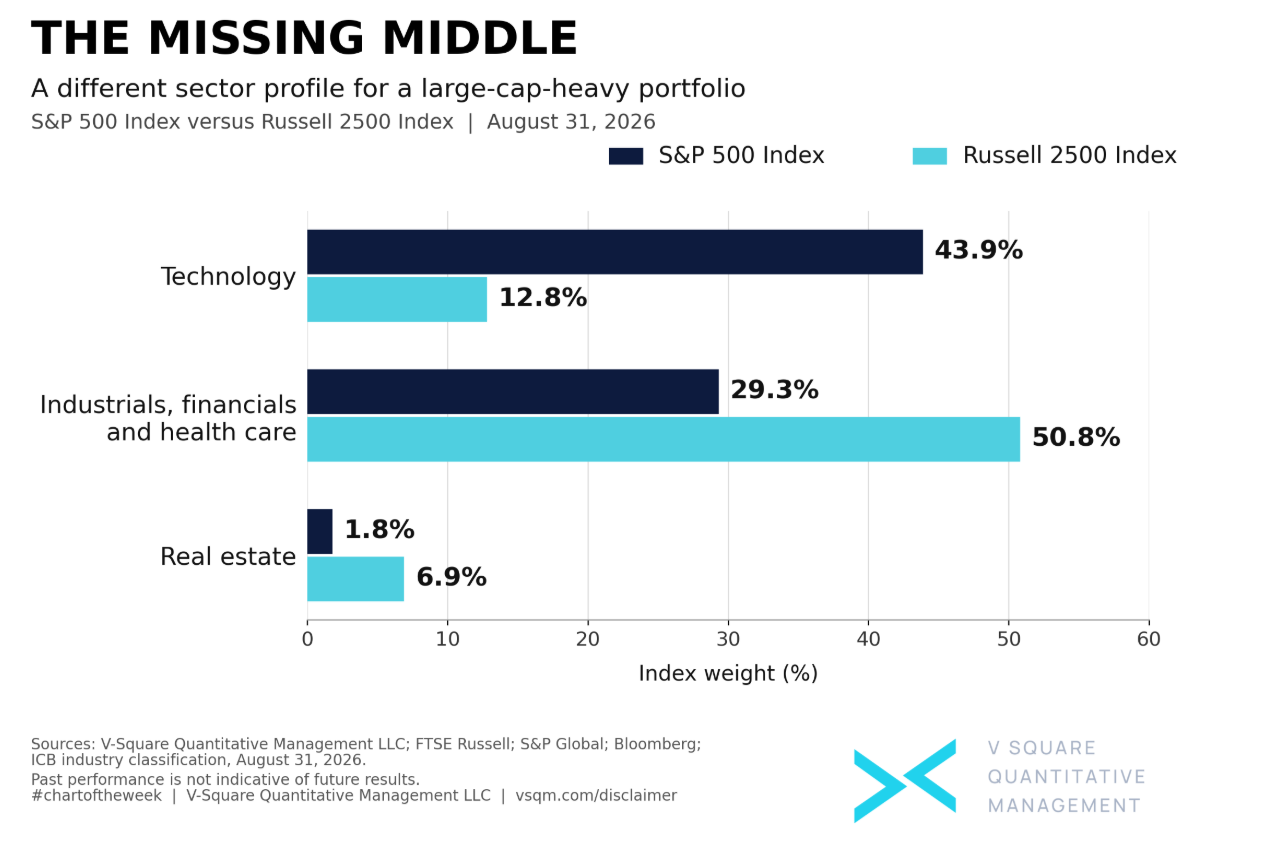
The Technology sector represents 43.9% of the S&P 500 Index, compared to a respective weight of 12.8% for the Russell 2500 Index. Industrials, Financials and Health Care sectors account for 50.8% of the Russell 2500 Index, versus 29.3% of the S&P 500 Index. The two indexes offer meaningfully different sector exposures.
For advisors, a thorough review of existing exposures, potential company overlap, and strategy implementation matters. Adding a SMID allocation without reviewing existing portfolio holdings can inadvertently increase exposure to companies the client already owns.
A systematic, completion approach to portfolio construction can address this by identifying those potentially overlapping securities. Advisors can exclude or constrain positions where appropriate, and optimize the remaining portfolio around valuation, quality, sector and factor exposures, tracking error and implementation costs. This thoughtful process allows an advisor to design a portfolio where the Russell 2500 Index remains the investment universe, whilst constructing a portfolio with the client's existing exposures in mind.
At V-Square, we believe SMID deserves consideration as a strategic allocation alongside a large-cap core exposure. Advisors have the ability to broaden the opportunity set and improve the construction of the total portfolio over a full market cycle.
Sources: V-Square Quantitative Management, Bloomberg, FTSE Russell, S&P Global. Data as of August 31, 2026. Performance figures represent total return data, and sector weights are based off ICB Industry Classifications.
This chart is for illustrative purposes only. Other indexes are available. It is not possible to invest directly in an index. Index returns do not reflect any management fees, transaction costs or expenses. Past performance does not guarantee future performance. The information and opinions contained herein are for informational purposes only, do not purport to be full or complete, do not constitute investment advice and may not be relied on. For more information, please see vsqm.com/disclaimer.