
This week, rising tensions in the Middle East and growing concerns over inflation and fiscal deficits drove a broad selloff in global bonds.
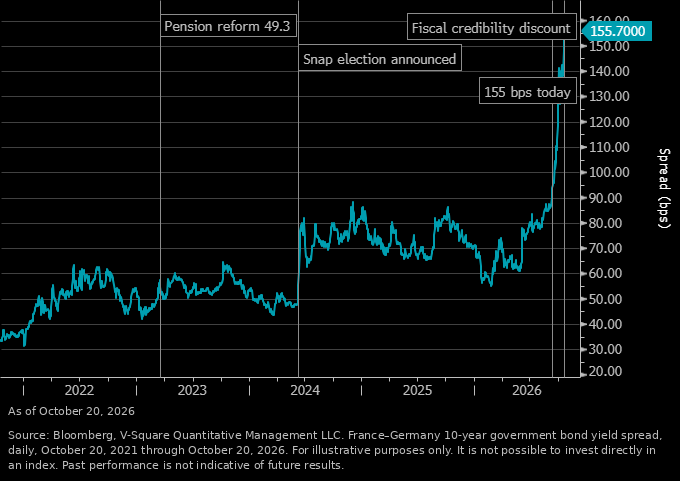

The U.S. 10-year Treasury yield reached 4.81% on September 2nd, its highest level since 2023. Japan's 10-year yield crossed 3% for the first time in roughly 30 years, and 10-year yields for Germany, France, and the U.K. all climbed to their highest levels in more than a decade. While Japan's yield level is currently the lowest of this group, depreciation of the Yen has led to some international concerns that further weakness could ripple into broader global bond markets. With Japan being one of the largest holders of U.S. Treasury debt, a weak Yen could pressure Japan to sell U.S. bonds to defend its own currency.
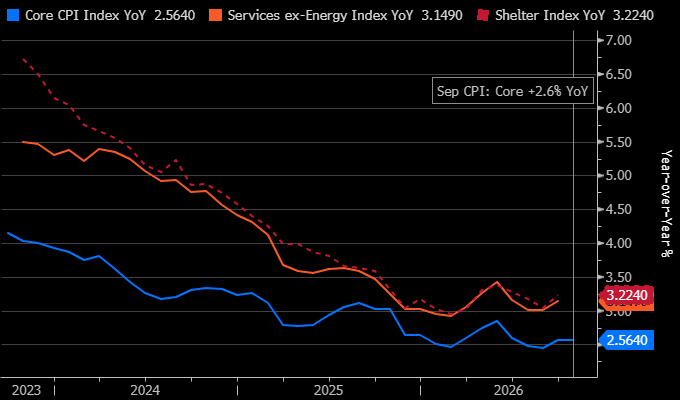
This global bond selloff reflects a combination of factors. Near-term, recent economic data and escalating geopolitical risks have shifted market expectations. Over a longer horizon, concerns around the persistence of inflation have been building, alongside growing unease about sovereign credit quality and the sustainability of fiscal deficits across major economies.
U.S. Central Bank rhetoric added to the shift. At Monday's G20 finance meeting in Asheville, Fed Chair Kevin Warsh, 100 days into his tenure, argued the economy has moved past the era of secular stagnation and into one of secular growth, echoing his Jackson Hole remarks days earlier. The meeting closed Tuesday without a joint communique of the agreements made, as China declined to join a consensus statement, leaving U.S. Treasury Secretary Bessent to issue a Chair's statement on behalf of the other members. Even coordination among the world's largest economies on growth and regulatory certainty remains contested, a backdrop that adds another layer of uncertainty on top of this week's yield move.
Market pricing reflects this shift. CME FedWatch currently shows roughly a 50% probability of a rate hike at the September U.S. Fed meeting. Looking out a year to the September 2027 meeting, the market assigns a ~95% probability of at least one 25bp hike from current target levels, with a ~74% probability of at least 50bps of rate hikes. Though these projections can shift quickly, they offer a meaningful window into the market’s expectations for the rate path ahead.
On the fiscal side, all five economies in this chart are running varying levels of budget deficits. International Monetary Fund data for 2026 shows the U.S. with the largest gap at -7.5% of GDP, while Japan shows the lowest gap at -2.0%. These differences are impactful, as wider deficits translate to increased borrowing, which can put upward pressure on yields as well as increase sensitivity to investor sentiment.
These pressures translate into equity markets as elevated fixed income base rates feed directly into valuation models and raise the required rate of return on equities, creating downward pressure on equity prices. When markets expect rates to stay higher for longer, that weight on equity prices becomes more persistent.
For investors, the implications are worth stating plainly. We are seeing stocks and bonds sell off together, a dynamic that has recurred with some regularity in recent years and that continues to challenge the assumptions underlying the traditional 60/40 portfolio.
In our view, this environment reinforces the case for genuinely diversifying return sources, including real assets and market-neutral strategies, that are less directly tied to the direction of interest rates.
Sources: V-Square Quantitative Management LLC; Bloomberg. Government 10-year benchmark bond yields for the United States, United Kingdom, France, Germany, and Japan. Weekly data from August 3, 2020, through September 2, 2026. For illustrative purposes only. Past performance is not indicative of future results. #chartoftheweek | V-Square Quantitative Management LLC | vsqm.com/disclaimer
This chart is for illustrative purposes only. Other indexes are available. It is not possible to invest directly in an index. Index returns do not reflect any management fees, transaction costs or expenses. Past performance does not guarantee future performance. The information and opinions contained herein are for informational purposes only, do not purport to be full or complete, do not constitute investment advice and may not be relied on. For more information, please see vsqm.com/disclaimer.