
Sector performance varies widely across the business cycle. In data we reviewed spanning 1960–2026 (sourced from Kenneth French's 49 Industry Portfolios, mapped to GICS sector classifications), we see evidence of defensive sectors holding up well during slowdowns and recessions, while cyclical sectors tend to lead as economic growth recovers.
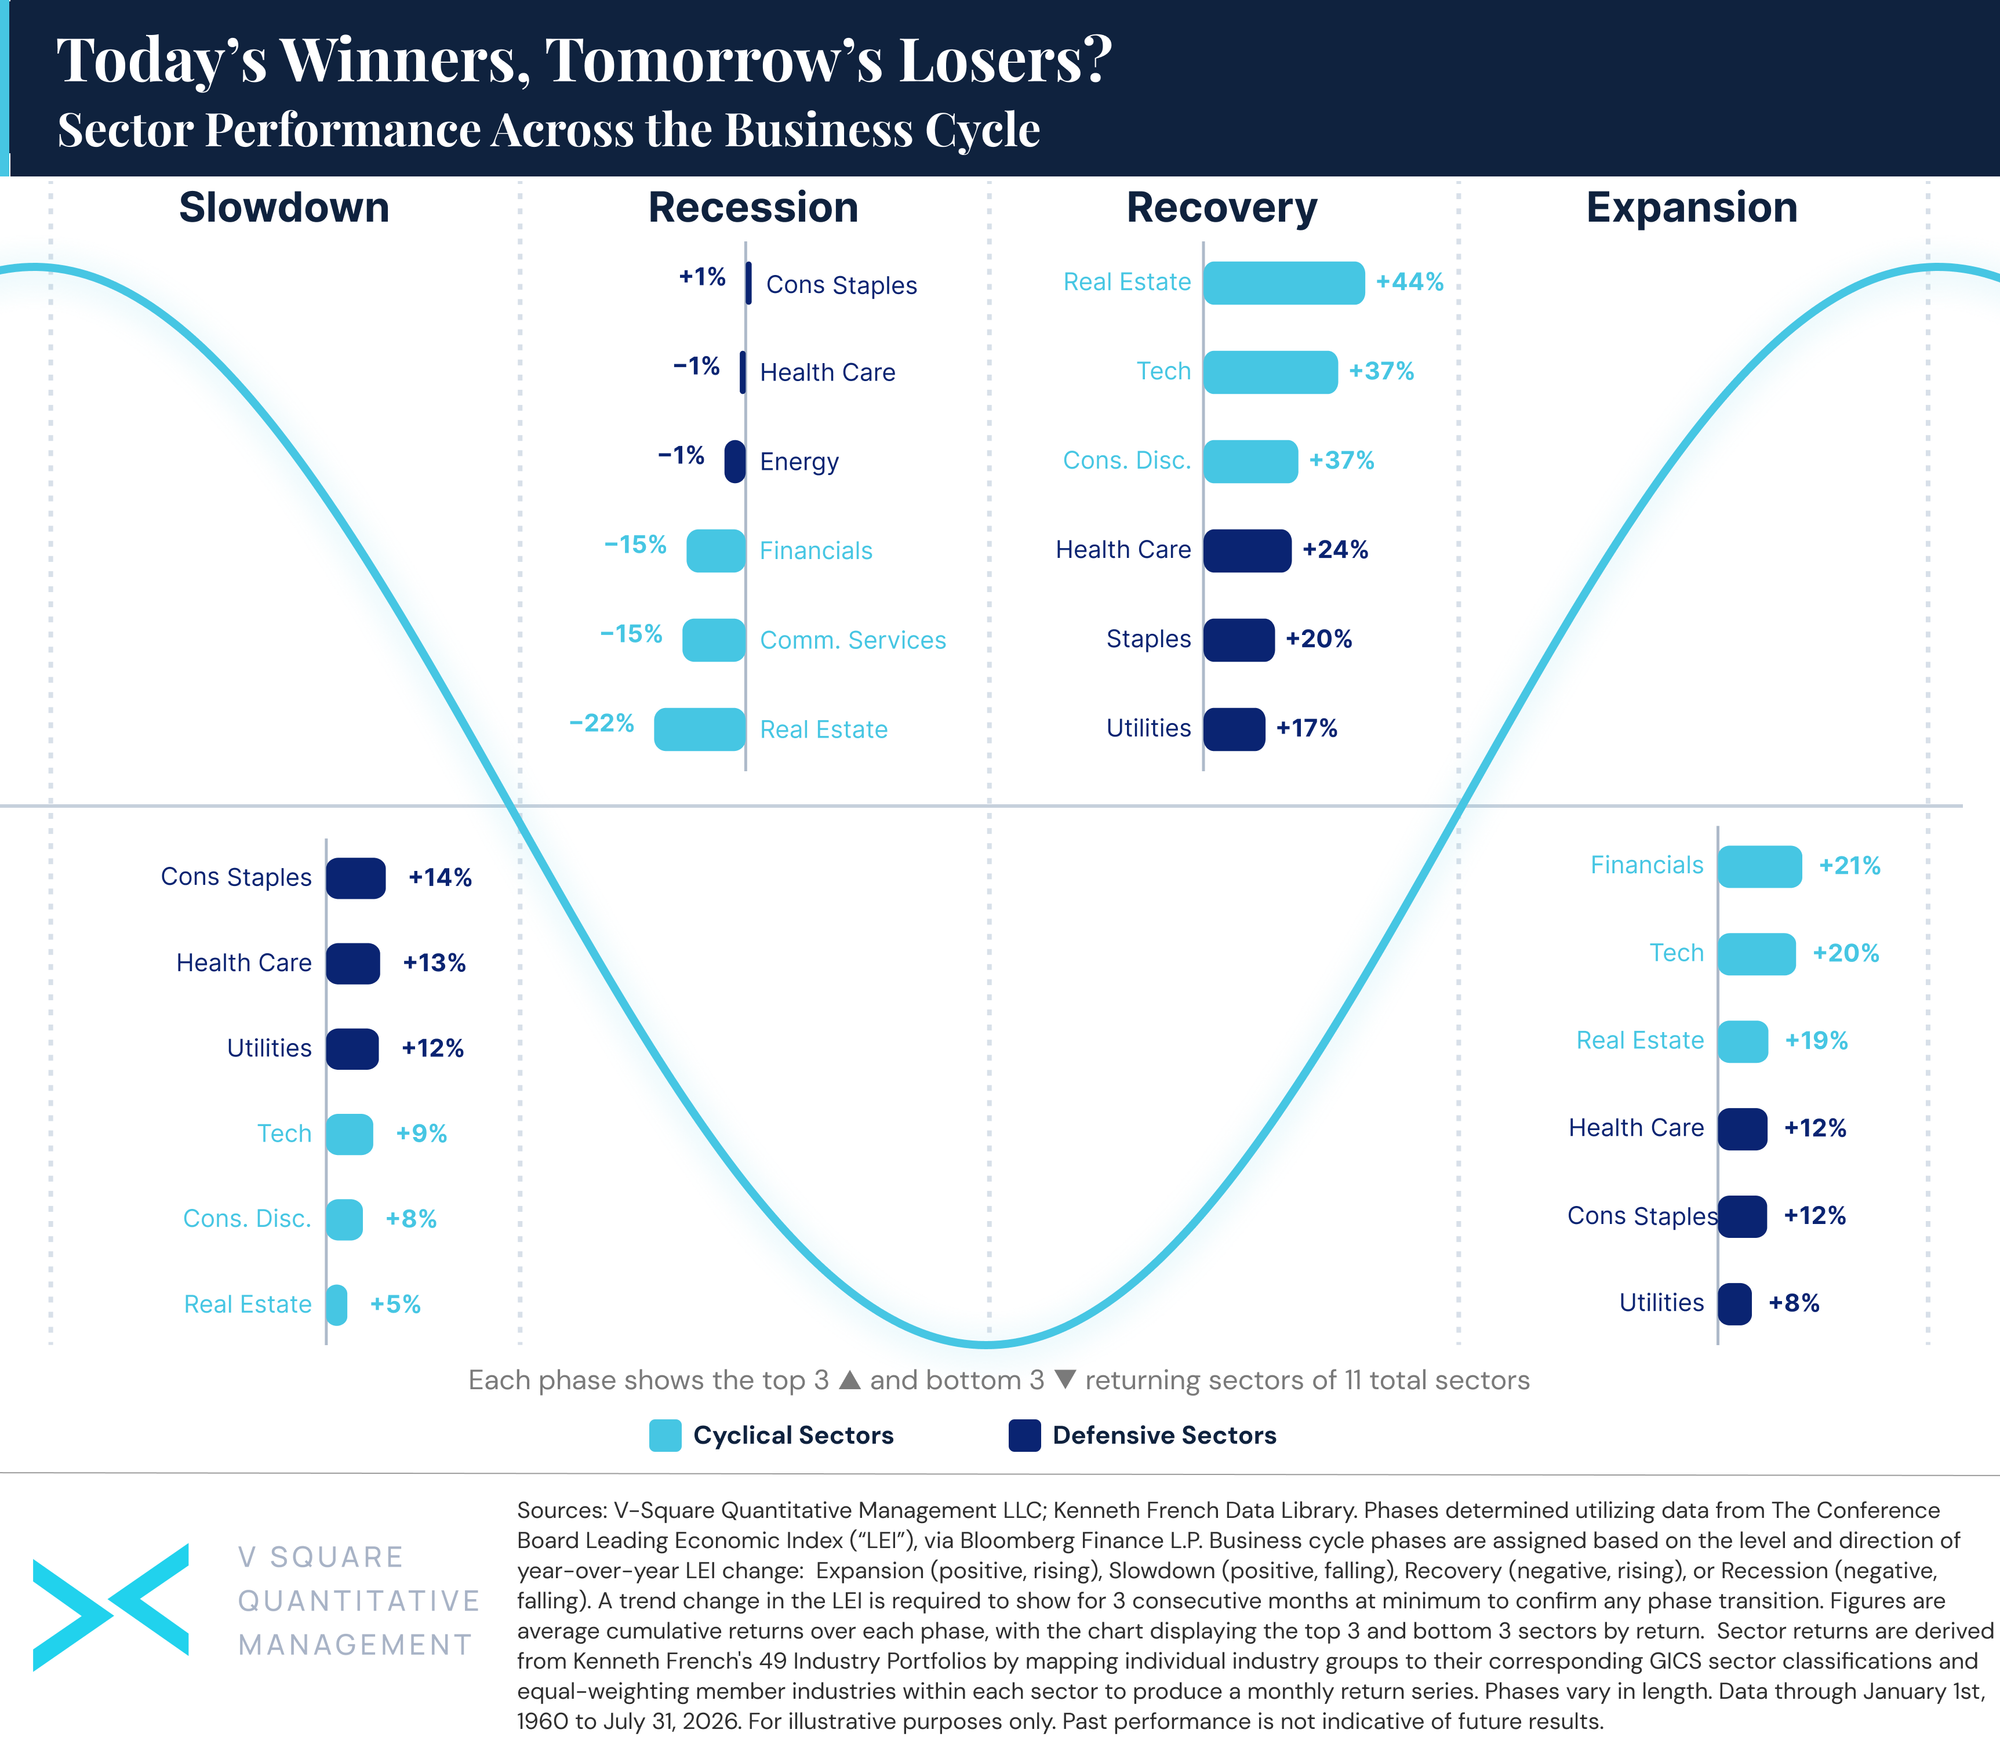
In this period, during recessions, Consumer Staples were the most resilient sector in our reviewed data, gaining roughly 1%, followed by Health Care and Energy, each declining around -1%. Cyclical sectors told a different story, with Real Estate (-22%), Communication Services (-15%), and Financials (-15%) posting the steepest declines in recessionary periods. This pattern largely then reverses during recoveries: Real Estate led at 44%, followed by Tech at 37%. Expansionary and slowdown phases, in our analysis, show a similar rotation with leading sectors in one phase giving way in the next, and former lagging sectors taking the lead.
The data indicates that return dispersion across sectors is somewhat narrower during slowdowns than during recessions and recoveries. To us, this implies that recessions and recoveries tend to be shorter, more concentrated phases of the cycle, where sector positioning can have an outsized impact on portfolio outcomes.
In our view, this reinforces the importance of diversification across sectors during all market cycles. While many investors have attempted to time the business cycle, history has shown this to be a difficult endeavor. Investors who rotate aggressively into leading sectors often find themselves on the wrong side when the cycle turns, and an equally sharp move into defensive positions can cause portfolios to lag in periods of sustained growth. With many investors today worried about the S&P 500 Index's concentration in AI- and semiconductor-related stocks, it is important to evaluate diversification across multiple layers in a portfolio.
Investors and advisors alike should keep in mind that the sector that leads outperformance in one period may not outperform in the next phase of the business cycle. Rather than aiming to time allocations around the business cycle, we believe investors can benefit most from monitoring alignment with long-term targets for sector, market cap, geographic, and factor risk exposures.
Sources: V-Square Quantitative Management LLC; Kenneth French Data Library. Phases determined utilizing data from The Conference Board Leading Economic Index (“LEI”), via Bloomberg Finance L.P. Business cycle phases are assigned based on the level and direction of year-over-year LEI change: Expansion (positive, rising), Slowdown (positive, falling), Recovery (negative, rising), or Recession (negative, falling). A trend change in the LEI is required to show for 3 consecutive months at minimum to confirm any phase transition. Figures are average cumulative returns over each phase, with the chart displaying the top 3 and bottom 3 sectors by return. Sector returns are derived from Kenneth French's 49 Industry Portfolios by mapping individual industry groups to their corresponding GICS sector classifications and equal-weighting member industries within each sector to produce a monthly return series. Phases vary in length. Data through January 1, 1960 to July 31, 2026. For illustrative purposes only. Past performance is not indicative of future results.
This chart is for illustrative purposes only. Other indexes are available. It is not possible to invest directly in an index. Index returns do not reflect any management fees, transaction costs or expenses. Past performance does not guarantee future performance. The information and opinions contained herein are for informational purposes only, do not purport to be full or complete, do not constitute investment advice and may not be relied on. For more information, please see vsqm.com/disclaimer.