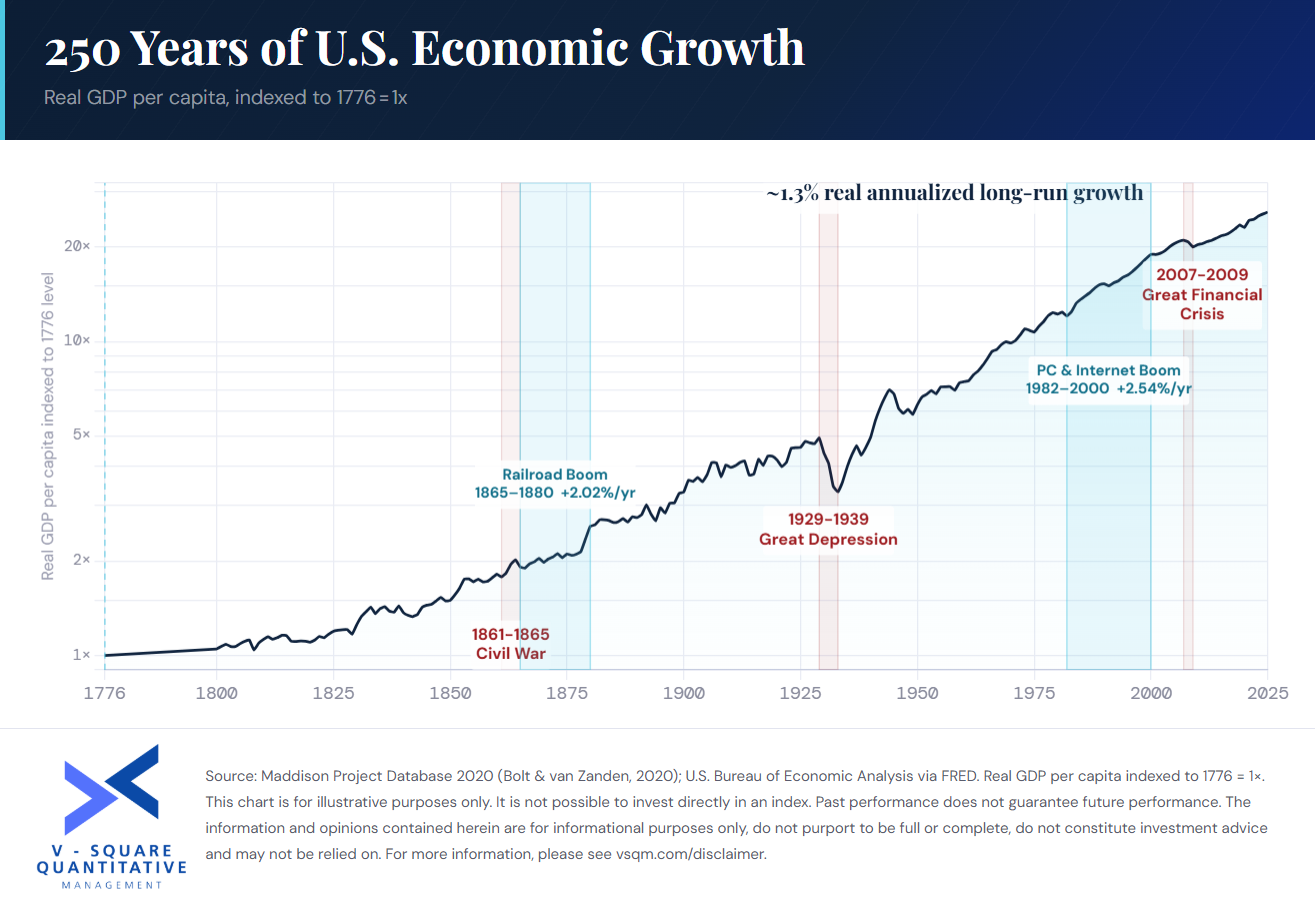
250 Years of U.S. Economic Growth
Wishing everyone a Happy Fourth of July. As America celebrates its 250th anniversary, we thought it was a fitting moment to reflect on the long-term economic picture.
RESEARCH //
Regular publications to articulate what we see and how we think
Wishing everyone a Happy Fourth of July. As America celebrates its 250th anniversary, we thought it was a fitting moment to reflect on the long-term economic picture.
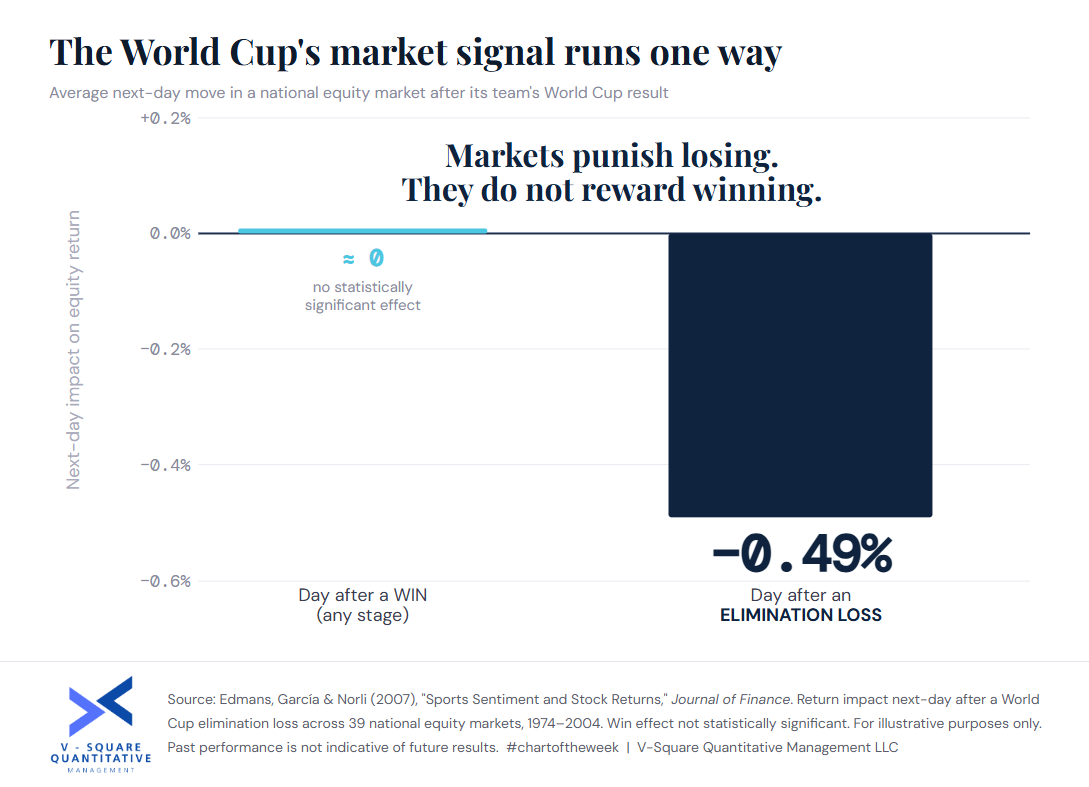
Two intuitive beliefs resurface every World Cup; that hosting enriches the host nation and that winning lifts the home market.
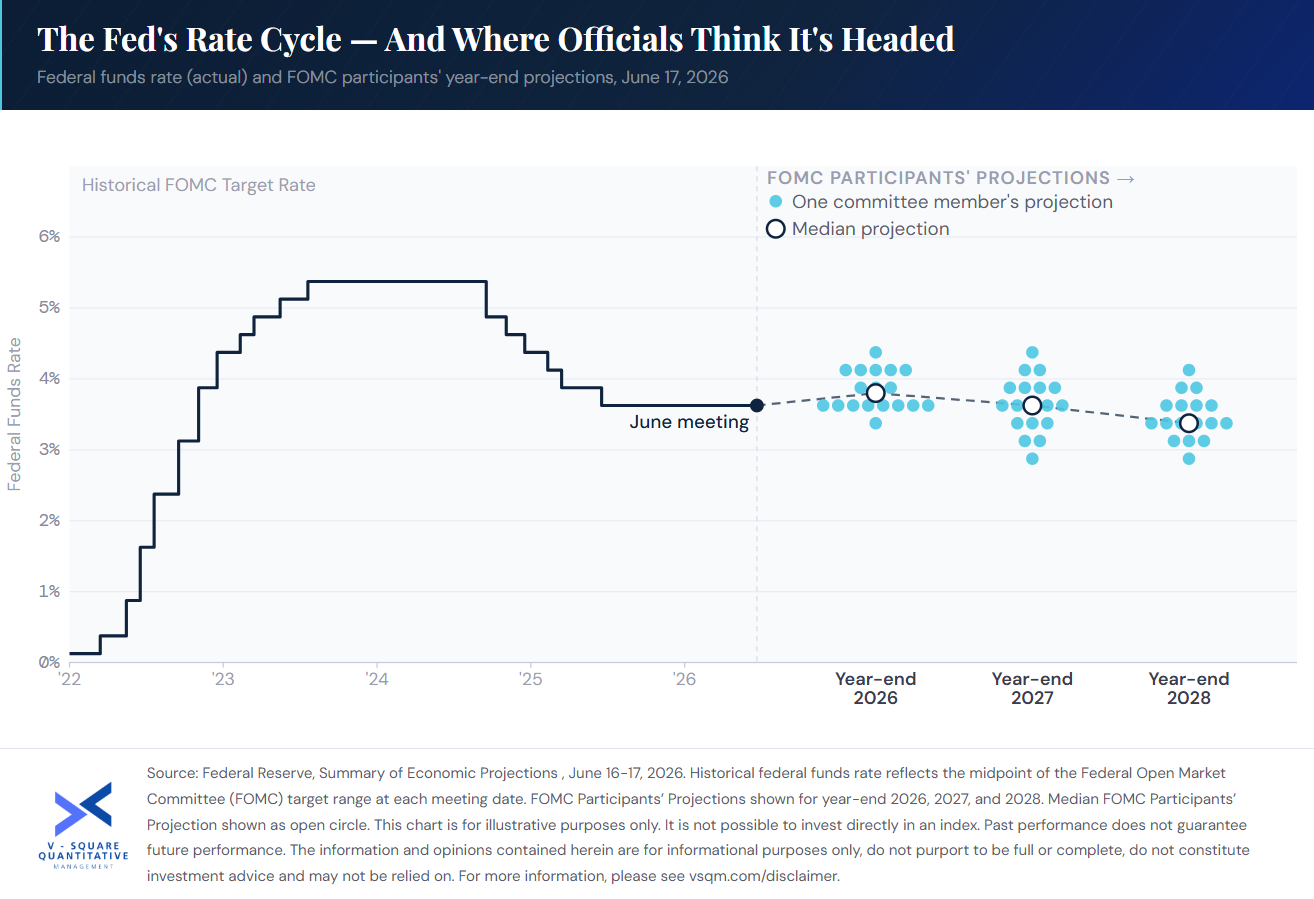
Kevin Warsh chaired his first Federal Open Market Committee (FOMC) meeting this week.
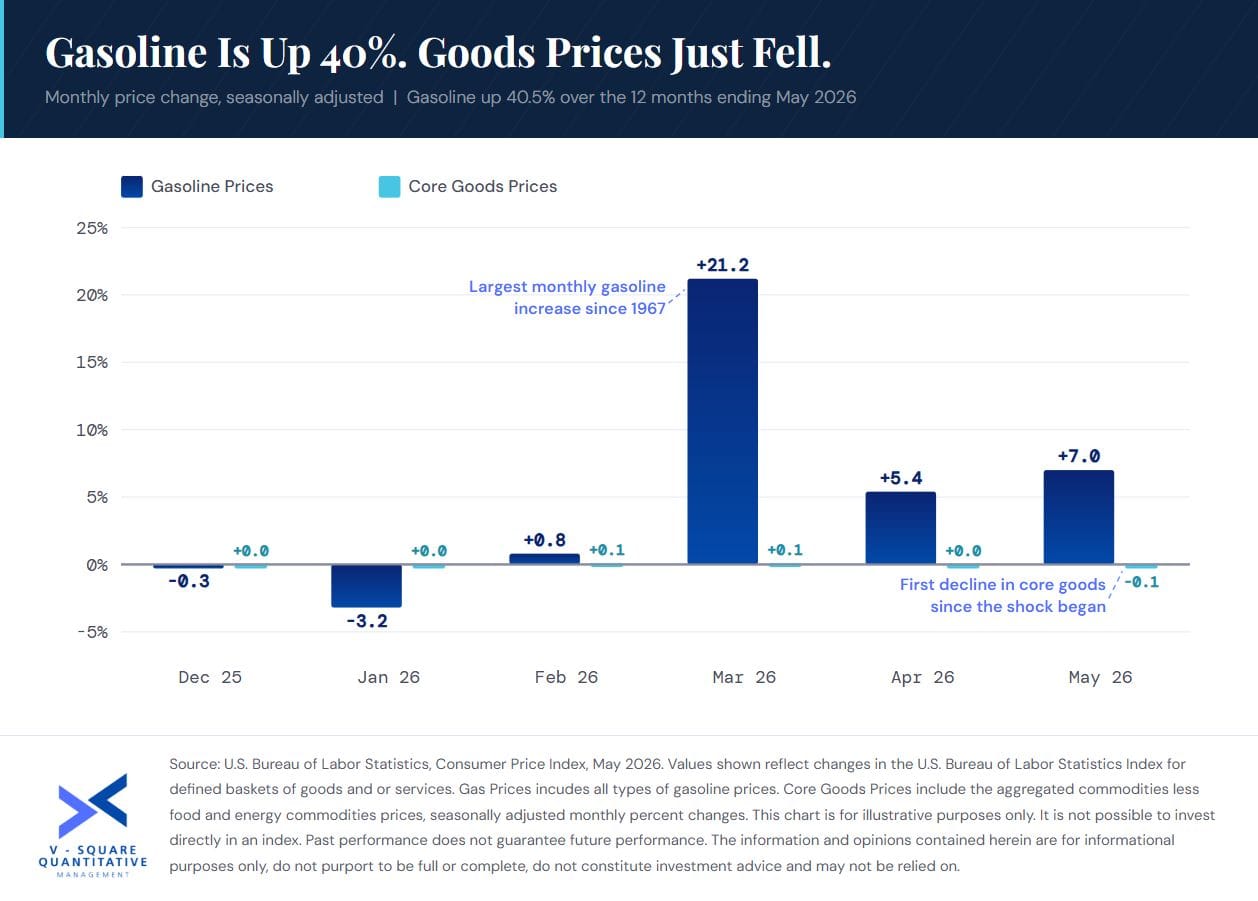
Headline inflation was +4.2% year-on-year (YoY)according to the Bureau of Labor Statistics’ May 2026 report. This is the highest YoY consumer price index number in three years, and it will likely lead the story heading into the Fed’s upcoming meeting on June 16, 2026. Just as interestingly,
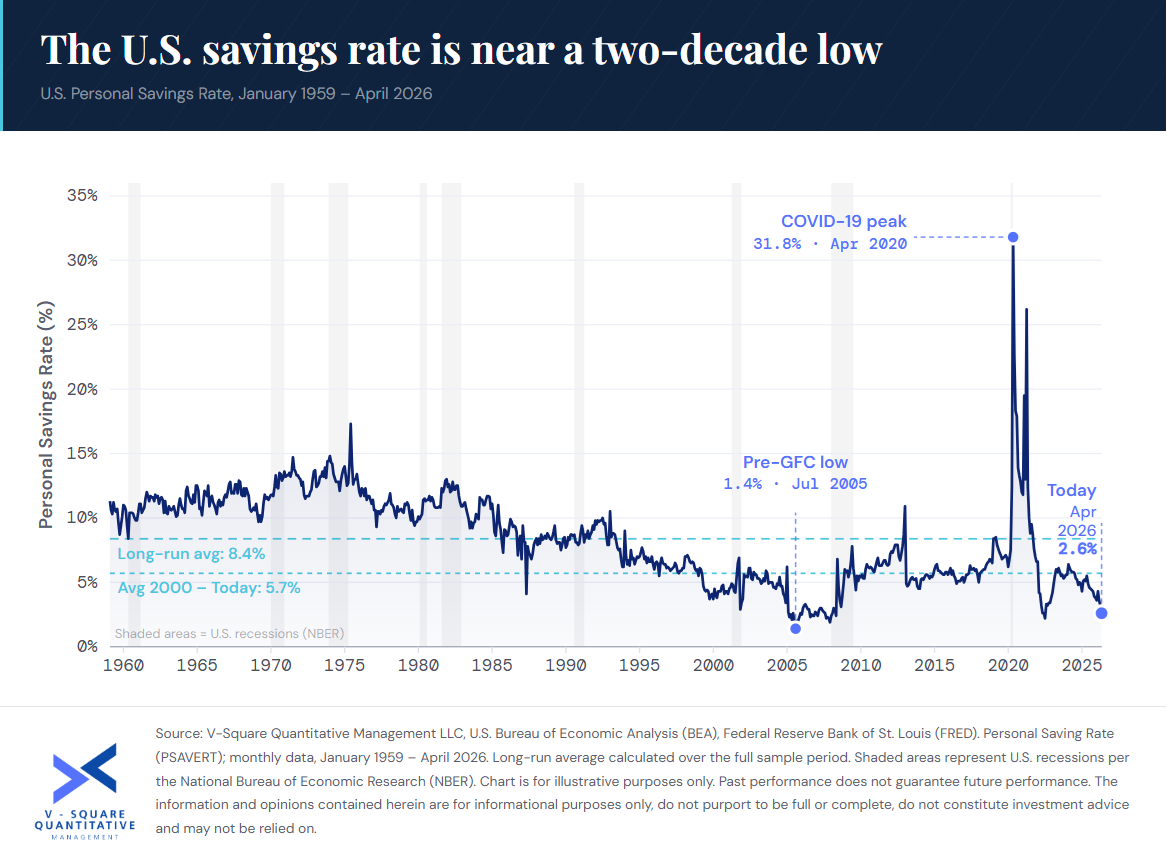
The U.S. personal savings rate fell to 2.6% in April 2026, less than a third of the long-run average of 8.4% recorded since 1959. Outside of a brief stretch before the 2008 financial crisis, Americans have rarely saved this little. The Bureau of Economic Analysis’ April 2026