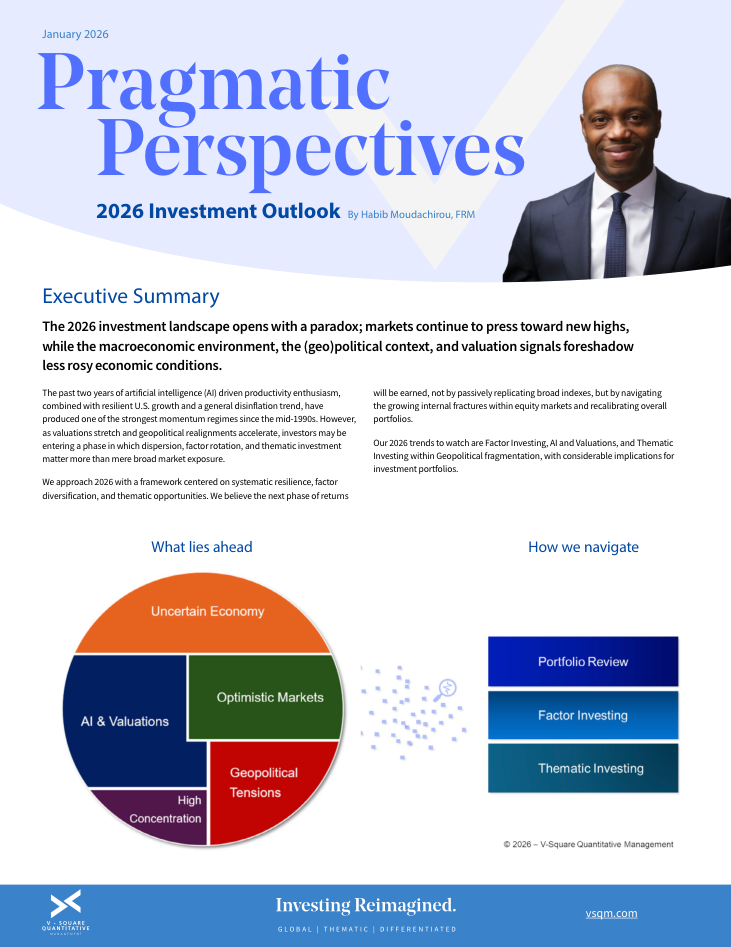
Pragmatic Perspectives.

Dashboard

Annual Greenhouse Gas Emissions

US Net Greenhouse Gas Emissions (Million metric tons CO2e)
Source: Rhodium Group

Utility-scale of photovoltaic capital cost

Overnight capital costs (2020, dollars per kilowatt)

Offshore wind capital cost

Overnight capital costs (2020, dollars per kilowatt)
Future dated policy assessment data based on the prediction models of Rhodium Group (“RHG”).
Modeling the future energy system is inherently uncertain. As a result, RHG provide two bounding cases that demonstrate policy results under more and less favorable conditions for achieving high levels of decarbonization as derived from the Rhodium Group Taking Stock 2021 report. The US GHG emissions is modeled using RHG-NEMS, a modified version of the National Energy Modeling System(“NEMS”) operated and maintained by RHG. NEMS is developed and used by the US Energy Information Administration (“EIA”) to produce its Annual Energy Outlooks (“AEO”). RHG expand on this model to include all sectors of the US economy with coverage for the six greenhouse gas categories.
Policy scenario explanations: “Current Policy” allows investors to explore outcomes under RHG’s existing emissions trajectory; reflecting federal and state policies as of May 2021. “Joint Action” allows investors to explore predictions under the ambitious suite of congressional, federal executive, and subnational actions modeled in this report (RHG, October 2021). “Low emissions” is defined as RHG’s lower bound emissions scenario, combining high natural gas and oil prices with low clean energy technology costs. “Central emissions” is defined as RHG’s central bound emissions scenario, combining moderate natural gas and oil prices with moderate clean energy technology costs. “High emissions” is defined as RHG’s upper bound emissions scenario, combining low natural gas and oil prices with high clean energy technology costs.
The information contained herein has been obtained from public sources and is believed to be reliable, but no representation or warranty, express or implied, is made that such information is accurate or complete and it should not be relied upon as such. The data may not be current and has not been independently verified by V-Square Quantitative Management LLC (“V-Square”). V-Square has no obligation to provide any updates or changes. All references are correct as of the date specified.

Library

Sign up to receive our latest research and insights.

Subscribe to Pragmatic Perspectives

Investing Reimagined.