Jan 28, 2022
8 minute read
Topic
Thought Leadership
2021 came and went as fast as 2020. The spotlight was on the accelerating climate crisis and the societal issues amplified by the global health crisis, including racial injustice and health inequity. In addition, to those crises, the world is also facing an unprecedented supply chain disruption that is being felt at all levels.
Environmental, Social, and Governance (ESG) investing gathered even more momentum in 2021, driven by regulation, market demand, and investor mandates. Pressure is also being applied on firms and organizations by their various stakeholders, including employees, clients, suppliers, and communities which they operate within. As a result, companies have been expanding their sustainability efforts from the goal-setting mode and literal policies to actual practices including education at the board and senior leadership levels and willingness to link executive compensation with ESG performance.
We reiterate our firm belief that sustainability adds value to companies’ profitability in the long run. In fact, shareholder primacy must no longer be opposed to stakeholder capitalism. Indeed, shareholder primacy, as defined by the Milton Friedman school of economic thought, is a shareholder-centric form of corporate governance that focuses on maximizing shareholder value, while stakeholder capitalism is a system in which corporations are oriented to serve the interests of all their stakeholders. We believe that within a long-termism framework, stakeholder capitalism serves well shareholder primacy; shareholder primacy needs stakeholder capitalism. Absent of that realization, value created at the expense of the non-investor stakeholders may only be short-lived.
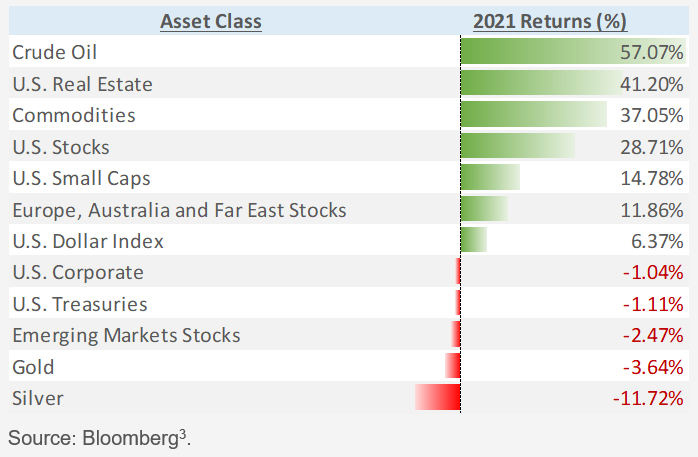
Looking at the financial markets, there was no dull moment in a year marked by the emergence of meme stocks1, a record number of IPOs, the SPACs2 roller-coaster, heightened volatility, increased investor activism, and two known dominant variants of the Covid-19 virus sweeping the globe. In 2021, U.S. and developed market equities kept roaring, nearly doubling their 2020 performance amid an intensive vaccine campaign and a globally renewed optimism for a full reopening of the economies. Real estate, crude oil, and commodities had a comeback year after a depressed 2020, contrasting with precious metals and U.S. fixed income which vastly underperformed.
The asset management industry saw large inflows, continuing a trend started in the second half of 2020, with a $1.1 trillion4 net inflows for US mutual funds and exchange-traded-funds (ETFs). Once again, ETFs gained market share on traditional mutual funds.
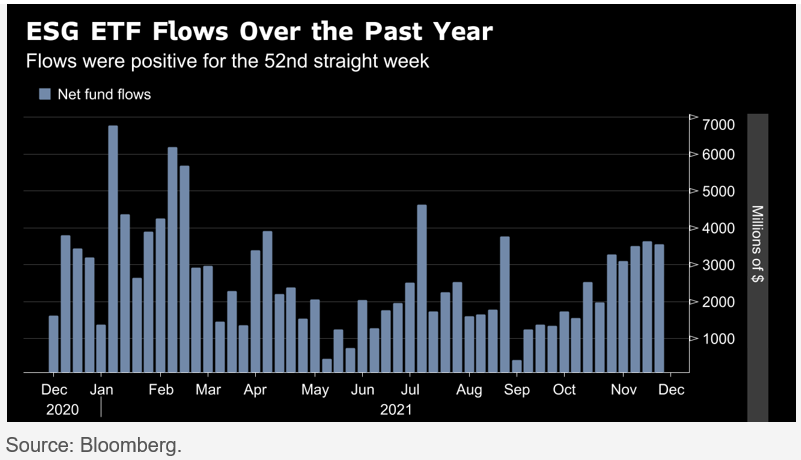
Investment products considering ESG in some capacity kept growing with an estimated $120 billion5 of net inflows for US ESG-focused ETFs, in line with the $135 billion5 net inflows seen in 2020. The pandemic, the resilience of those investments throughout the health crisis, and the climate-driven government policies and investments helped to accelerate the trend. ESG became mainstream and is moving from a “nice-to-have” feature to a “must-have” attribute. It is estimated today that 1 out of every 3 dollars is invested in ESG. We expect this upward trend to persist in 2022 and in the years to come.
Our four ESG trends to watch in 2021 were the renewed focus on the climate risk, human capital (No S without G in the land of ESG), the advent of materiality, and the immense opportunity presented by the ESG debt. Not only did we see those topics become a priority for investors, but we also have the conviction that more clarity, specification, and investment tools are in store for 2022. Here are the four trends to watch in 2022.
1. The Net Zero transition –Practices over pledges.
Net Zero, generally referring to net zero carbon emissions, was potentially one of the most uttered, written, and researched two-words in 2021 in the ESG realm. Climate change was finally recognized by most as a clear and present danger for our planet and its people, mainly because of its physical manifestations, including extreme temperatures, sea-level rise, and increasingly frequent, intense natural disasters. The ensuing rational question is how to slow down and reverse the global warming causing it.
The scientific community commonly agrees that carbon emissions are a big source of global warming, and as a result, governments and firms around the world understand that reducing carbon emissions will help limit temperature rises to 1.5 °C /2 °C above pre-industrial levels. We witnessed an avalanche of pledges from governments, states, and firms promising to reduce their net carbon emission to zero by 2035 for the fastest and by 2050 for the majority. According to the latest McKinsey Net Zero Transition Report6, more than 70 countries accounting for more than 80 percent of global CO₂ emissions and about 90 percent of global GDP have committed to net-zero, as have more than 5,000 companies. The November 2021 COP26 Climate Summit in Glasgow has disappointingly proved a coordinated and cohesive resolution to be difficult; meaning businesses and investors will need to drive the agenda as they grasp the reality and the urgency of the transition.
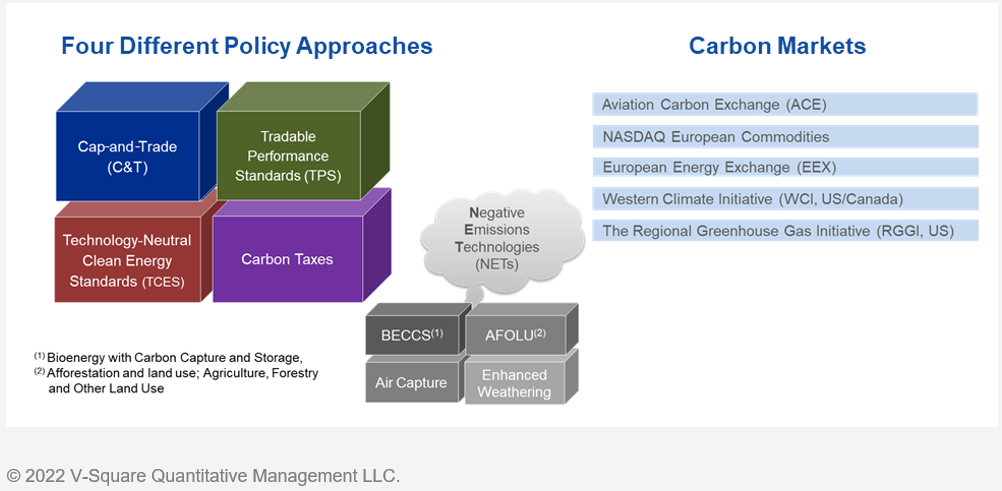
The path to a low carbon economy is one that presents risks and opportunities. Various levers and tools are currently being utilized, including legislation and policies enacted, notably in Europe, to compel companies to move toward a low carbon economy. Notably, calls for the creation of more stringent clean energy standards, the carbon tax, and the cap-and-trade approach. The carbon tax is a policy that attempts to quantify the cost of carbon emissions with a fee imposed on the burning of carbon-based fuels (coal, oil, gas). Cap-and-trade is the system for controlling carbon emissions and other forms of atmospheric pollution through government established limits on the amount of pollution a given business or other organization may produce. However, this system allows firms to trade in unused emissions. The most known cap-and-trade system is the Emission Trading Scheme (ETS), where emitters of greenhouse gases (GHG) can trade emission units to meet their emission targets.
From an investment perspective, granting that a combination of incentive-based policies, market mechanisms, and technology innovations are the minimum interventions required to attempt to mitigate the global average temperature rise, the major risks faced by client portfolios are companies not adapting quickly to the transition and being left with obsolete operations, stranded assets, and increased liabilities. This will directly affect their balance sheets by reducing shareholders’ equity, as Shareholders' Equity = Assets – Liabilities, per the Balance Sheet Equation.
A soaring carbon price on proliferating carbon markets, high-tech innovation such as carbon removal and sequestration, climate-friendly legislative bills, and sizable spending by governments in low-emission infrastructures around the world, all provide massive opportunities for companies that will need to adapt, innovate, and provide transition-related services and products which will inevitably be in high demand. Therefore, in 2022 we expect more investment products to focus on the transition to net zero, more probingly looking at the actual practices and the opportunity trajectory rather than merely settling for pledges and policies. Furthermore, it helps that data availability is ever-increasing as well as coverage of key metrics such as Scope 1, 2, and 3 emissions7.
2. Leadership diversity – Unlock the value as a corporate performance driver.
In our 2021 letter, we stressed the fact that there could not be an S without a G. Of the three letters E, S, and G, the S for Social is now being acknowledged as a critical piece of the sustainability effort. The S is directly linked to human capital, which we believe is the most important input of any organization. Too often have we counted on an organizations’ goodwill to address social issues; now steps are being taken by governing and regulatory bodies to create incentives, and de facto make the S a part of good corporate governance. The two years (and counting) of the Covid-19 pandemic shined a bright light on social inequalities and exposed the cost of ignoring them or of not treating the workforce well.
This past summer, the Security and Exchange Commission (SEC) approved the Nasdaq Board Diversity Rules requiring Nasdaq-listed companies to disclose board composition demographics and for most to have a minimum of two self-identified diverse directors by 2023. Other organizations, governmental or non-governmental entities such as the UK Financial Conduct Authority (FCA) and the Singapore Exchange are following with similar proposed requirements.
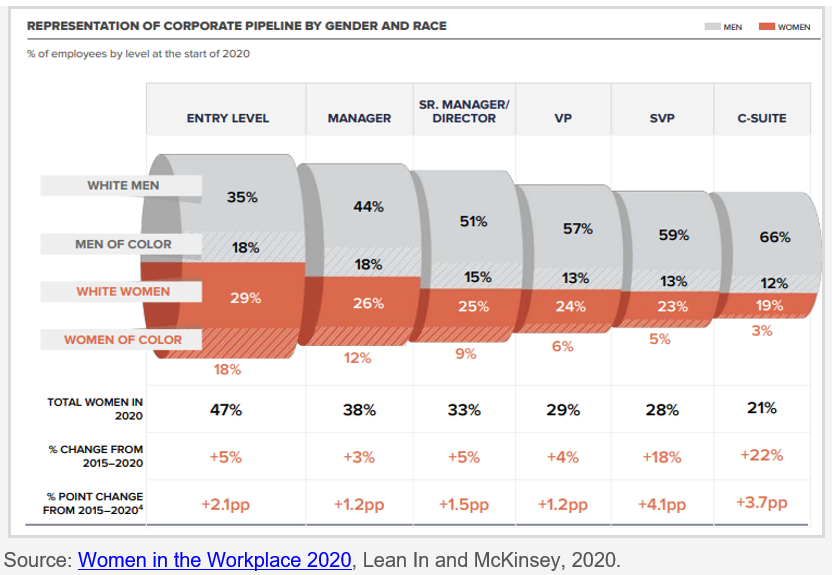
We firmly believe that true diversity, equity, and inclusion (DE&I) within organizations is vital for a healthy culture and subsequently to attract, retain, and develop talents. While firms did implement recruitment policies accounting for diversity and we see a reasonably good representation at entry-level roles, the proportions of women and minorities inexorably dwindle away as they move upward the corporate ladder.
Academic research finds that an effective way to implement DE&I is to start at the top, at the leadership level. Scholars call this the trickle-down effect as “it takes effort to put together a high-functioning, diverse team. This effort is rewarded with the ability to attract and retain top talent, improved business strategy and more. Emerging leaders and top performers want to see themselves reflected at the top. End users are best served by having their point of view represented by someone at the table”8.
Implementing diversity is hard work and must be done well to reap the benefits. We published a paper last year on the topic that drew a parallel with diversification in portfolio management and in corporate strategy. Companies diversify their outputs to gain a strategic edge, why not the inputs? Human capital is a key capital and input, so why overlook the value of diversifying it? Scores of studies demonstrate the value of diversity, and we must remember that beyond the bottom line, it creates value by expanding the talent pool and enriching its perspectives.
Lastly, considering that a lack of diversity and inclusion can also drive poor decision-making, investors are realizing that diversity is not priced because it is not given any value. We expect investors to gain the ability to unlock the diversity value through products which select and invest in companies that are proficiently leading on that front.
3. ESG materiality – Bridge the reporting/investing gap.
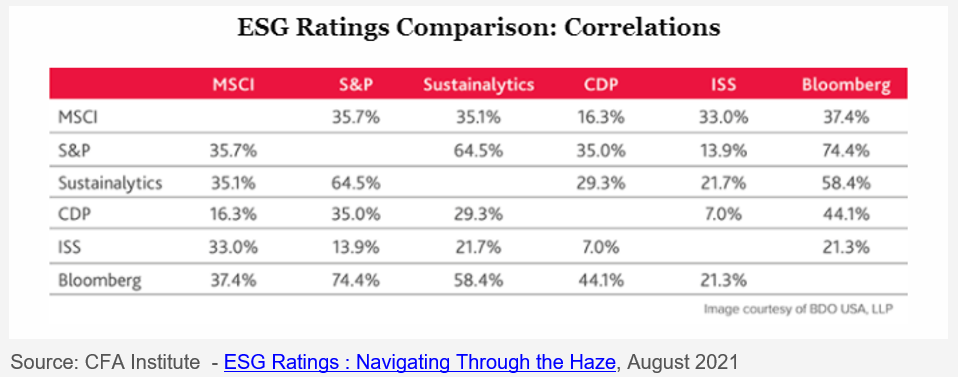
As ESG demand grows, so does the data offering, evidenced by the explosion of data. We count more than 140 different ESG data providers, compounded with the fact that each of them offers dozens of ratings, scores, hundreds of metrics, with some utilizing big data and artificial intelligence (AI) technologies. For instance, Goldman Sachs counts 18 million cumulative ESG datapoints available for 558 metrics for their latest company coverage in their GS Sustain report. Moreover, the larger consulting firms and accounting Big Four firms all added a sustainability-focused proposition to their services. Traditional credit rating agencies also joined the chorus with various ESG data and ratings service offerings.
Unfortunately, most ESG data still relates to vague policies and, short of more standardization, the ESG confusion will only keep growing. In addition to the well-documented flaws of calculated scores including reliability, coverage, comparability, lack of transparency, methodology biases, investors must beware of greenwashing and greenwishing. Likely more dangerous than greenwashing, greenwishing is the overblown optimism that one’s sustainability efforts are more impactful, intentional, and closer to achieving the necessary change than they really are. Greenwishing is mostly guided by honest intentions, though it gives a false sense of achievement.
Pressure is mounting for fund managers to prove their truthfulness to investors about their ESG-labeled products. For illustration, the SEC and BaFin, the German regulator, initiated a probe this past summer into allegations of ESG misstatements by the Deutsche Bank AG’s DWS Group’s asset-management arm. In Europe, the EU taxonomy sets a general framework for a unified EU classification system, while the Sustainable Finance Disclosure Regulation (SFDR) requires that fund managers evaluate and disclose their financial products’ ESG features between two groupings: Article 8 “light green” funds defined as those that actively promote environmental or social characteristics, and Article 9 “dark green” funds that have sustainable investment as their main objective.
A good way to avoid many of the objections to the various ratings is to not solely rely on them. One must instead go one or two layers deeper and focus on the raw data behind the scores. In last year’s V-Square ESG Trends to Watch, we predicted that materiality would prevail. Since it is not possible to incorporate all ESG metrics in portfolios, we must at minimum identify and incorporate the metrics that research finds to have an impact on valuations and financial risk and as a result, may provide a financial benefit for portfolios. Concurrently, investors are ever more calling for reliable, transparent, and comparable reporting by companies on climate and other ESG matters.
As expected by most, 2021 was a turning point in ESG data harmonization, driven by regulation and consolidation of reporting standards. The Sustainability Accounting Standards Board (SASB9) completed their merger with the International Integrated Reporting Council (IIRC) in June 2021 to become a unified organization, the Value Reporting Foundation, which simplifies the corporate reporting landscape and system. The market vision remains to move toward a more standardized, consistent, and comprehensive corporate reporting system as they keep working with other ESG standard-setters like CDP (formerly the Carbon Disclosure Project), CDSB (Climate Disclosure Standard Board), and GRI (Global Reporting Initiative). In a similar move, this past November, the IFRS Foundation announced the creation of its new International Sustainability Standards Board (ISSB) that will develop a comprehensive global baseline of high-quality sustainability disclosure standards to meet investors’ informational needs.
Asset owners are increasingly adopting the materiality map of SASB as a framework for reporting, primarily because SASB has developed a suite of industry-specific standards focused on ESG issues that have a financial impact. The idea stems from the simple realization that every sub-industry has its own set of ESG issues that matters. Asset owners’ main challenge is then to reconcile the more commonly used investment GICS® sectors10 with the SASB industry nomenclature. None of the broad investment solutions currently available are intentionally constructed with an alignment with the SASB framework. Investment products bridging the SASB/GICS gap should be in high demand by investors who are already committed users of the SASB materiality framework.
4. ESG Debt – The opportunity goes beyond the touted $11 trillion.
Last year we said that “ESG debt is well on its way for a third trillion in 2021, and it is poised to balloon to $11 trillion by 2025”. The actual numbers are stunningly higher as sustainable debt surpassed the $4 trillion mark of total issuance for environmental, social and governance purposes, according to BloombergNEF (BNEF) in 2021. For perspective, it took 12 years to accumulate the first trillion of dollars in 2018, two years to reach the second trillion, and then 14 months to add another $2 trillion, with $1.6 trillion accumulated in 2021 alone.
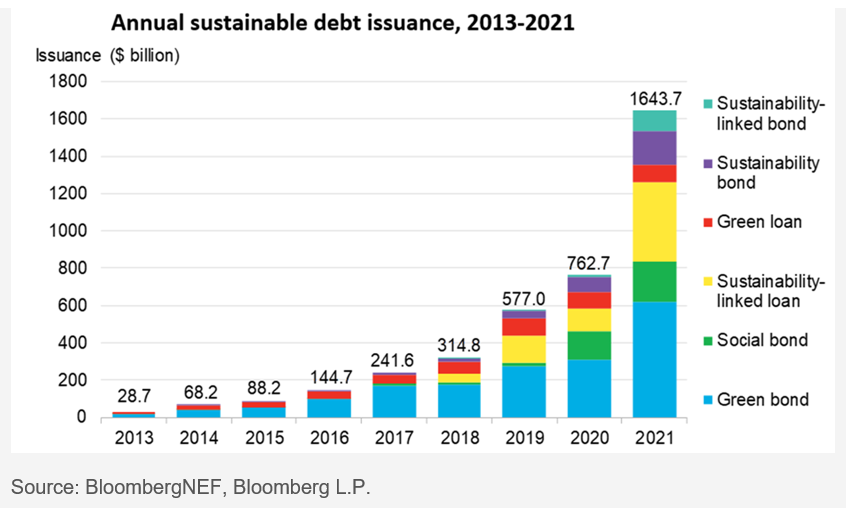
The growth of ESG debt issuance is propelled by the pledges to transition to a low carbon economy and by the need to tackle the social issues magnified by the global Covid-19 pandemic. The surge in issuances has primarily been driven by green bonds, defined as fixed-income securities in which the proceeds will be exclusively and formally applied to projects or activities that promote climate or other environmental sustainability purposes through their use of proceeds. Green bonds represented 45 percent of the $4 trillion of sustainable debt issued through 202111. Moreover, demand for social and sustainability bonds are also remarkably catching up with green bonds given an unanticipated, rapid development; they represented approximately a quarter of the sustainability debt issued in 2021. Social and sustainability bonds aim to finance social and community-based projects in full or combined with green objectives, often targeting vulnerable populations.
The sustainable debt universe also includes green loans, sustainability-linked bonds, and sustainability-linked loans that follow the use-of-proceeds requirements or guidelines set by the International Capital Market Association (ICMA) and the Loan Market Association (LMA). As the challenges of labeling inconsistencies and greenwashing are also present for fixed-income securities, regulators and governing bodies around the world are diligently looking to ease investors’ concerns by working to define a framework of disclosures, monitoring, and auditing of the sustainability-related statements.
Though growing investor demand is driving the ESG debt market expansion, ESG debt currently represents a tiny fraction of the larger debt market. Debt markets are not immune to the increasing demand for ESG products; issuers are quickly realizing that aligning their offering with investor demand unlocks access to new pools of financing and favorable pricing.
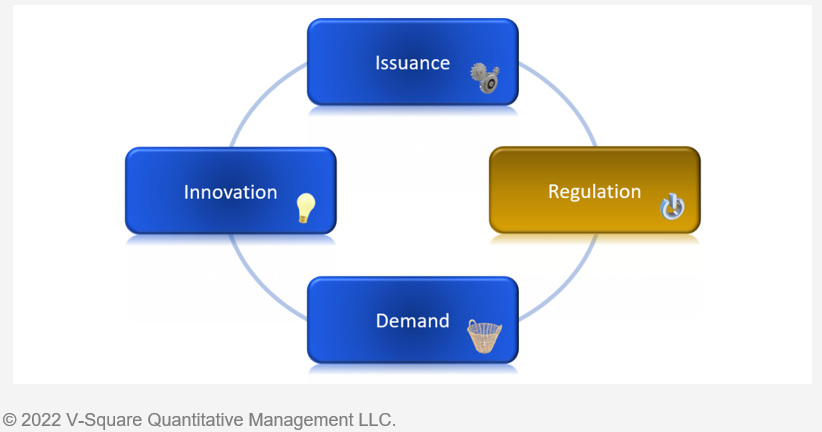
We see no slowing down of the explosion of ESG debt in 2022. We even expect a growing involvement of corporates in a field historically dominated by sovereigns, government agencies and supranationals. Reflecting on the developments of the past 12 months, we added a fourth brick, Regulation, to the Demand-Innovation-Issuance virtuous circle we introduced last year. We understand that the circle can only remain virtuous if, while demand does fuel innovation and issuance growth, regulation e.g., legislative mandates and rules, matches pace to continuously seek to certify the integrity of the products.
As we look forward through 2022, we are thrilled to see the industry recognize the opportunities ahead and take on the many complex challenges that come. As investors and stewards of our clients' capital, we strongly believe that the trends outlined above will improve our ability and skillfulness to incorporate ESG factors into client portfolios.
Footnotes
1 A meme stock is a stock that gains popularity among retail investors through social media. The popularity of meme stocks is generally based on internet memes shared among traders, on platforms such as Reddit's r/wallstreetbets. Investors in such stocks are often young and inexperienced investors. GameStop and AMC were popular meme stocks in 2021.
2 A Special Purpose Acquisition Company (SPAC) is a shell corporation listed on a stock exchange with the purpose of acquiring a private company, thus making it public without going through the traditional initial public offering process.
3 Data as of December 31, 2021. Past performance is not indicative of future results. The source for each asset class is set forth in descending order: WTI U.S. Oil, Dow Jones Real Estate Index, S&P GSCI, S&P 500, Russell 2000, MSCI EAFE, DXY, Bloomberg US Corporate Bonds Index, iShares US Treasury Bond ETF, MSCI EM, XAUUSD, XAGUSD. See more information in Appendix.
4 Source: Morningstar, as of November 2021.
5 Source: Bloomberg, as of November 2021.
6 McKinsey & Company Report – Report - The net-zero transition. What it would cost, what it could bring.
7 Greenhouse gas emissions are classified into three groups or 'Scopes' by the most widely used international accounting tool, the Greenhouse Gas (GHG) Protocol. Scope 1 covers direct emissions from owned or controlled sources. Scope 2 covers indirect emissions from the generation of purchased electricity, steam, heating, and cooling consumed by the reporting company. Scope 3 includes all other indirect emissions that occur in a company’s value chain, i.e., everything beyond its direct operations and electricity use, including supply-chain operations and end-product usage by customers.
8 Source : Forbes Council Coaches, 14 Important Benefits Of A More Diverse Leadership Team.
9 SASB was founded as a non-profit organization with the mission of establishing industry-specific disclosure standards across ESG topics to facilitate communication between companies and investors about financially material, decision-useful information.
10 The Global Industry Classification Standard (GICS®) – In 1999, MSCI and S&P Dow Jones Indices developed the Global Industry Classification Standard (GICS), seeking to offer an efficient investment tool to capture the breadth, depth, and evolution of industry sectors. GICS is a four-tiered, hierarchical industry classification system: 11 sectors, 24 industry groups, 69 industries, and 158 sub-industries. Companies are classified quantitatively and qualitatively. Each company is assigned a single GICS classification at the Sub-Industry level according to its principal business activity.
11 Source: BloombergNEF
Appendix - Asset Class Description
XAGUSD
Silver Spot price quoted as US Dollars per Troy Ounce.
XAUUSD
Gold Spot price is quoted as US Dollars per Troy Ounce.
Russell 2000
The Russell 2000 Index is comprised of the smallest 2000 companies in the Russell 3000 Index, representing approximately 8% of the Russell 3000 total market capitalization.
S&P 500
The S&P 500® is widely regarded as the best single gauge of large-cap U.S. equities and serves as the foundation for a wide range of investment products. The index includes 500 leading companies and captures approximately 80% coverage of available market capitalization.
MSCI EM
The MSCI EM (Emerging Markets) Index is a free-float weighted equity index that captures large and mid-cap representation across Emerging Markets (EM) countries. The index covers approximately 85% of the free float-adjusted market capitalization in each country.
Bloomberg Barclays Corporate Bonds Index
The Bloomberg Barclays U.S. Corporate Bond Index measures the investment-grade, fixed-rate, taxable corporate bond market.
MSCI EAFE
The MSCI EAFE Index is a free-float weighted equity index. The index was developed with a base value of 100 as of December 31, 1969. The MSCI EAFE region covers DM countries in Europe, Australasia, Israel, and the Far East.
iShares Trust US Treasury Bond ETF
The iShares U.S. Treasury Bond ETF seeks to track the investment results of an index composed of U.S. Treasury bonds.
S&P/TSX Composite
The S&P/Toronto Stock Exchange Composite Index is a capitalization-weighted index designed to measure market activity of stocks listed on the TSX.
S&P GSCI
The S&P GSCI® is widely recognized as a leading measure of general price movements and inflation in the world economy. It provides investors with a reliable and publicly available benchmark for investment performance in the commodity markets.
DXY
The U.S. Dollar Index (USDX) indicates the general int'l value of the USD. The USDX does this by averaging the exchange rates between the USD and major world currencies.
Dow Jones Real Estate Index
Dow Jones EQUITY REIT Total Return Index. This index is comprised of REITs that directly own all or part of the properties in their portfolios. Dividend payouts have been added to the price changes. The index is quoted in USD.
WTI U.S. Oil
Bloomberg's spot crude oil price indications use benchmark WTI crude at Cushing,OK ; and other U.S. crude oil grades trade on a price spread differential to WTI, Cushing.
Disclaimers and Important Information
© 2022 V-Square Quantitative Management LLC. All rights reserved
Unauthorized copying, reproducing, duplicating, or transmitting of this document are strictly prohibited in whole or in part without the express permission from V-Square Quantitative Management LLC (“V-Square"). This material is provided for informational purposes only and is not intended to be, and should not be construed as, an offer, solicitation, or recommendation with respect to any investment service or product provided by V-Square. Furthermore, the information contained here should not be treated as legal, investment, or tax advice. Recipients should not rely upon this information as a substitute for obtaining specific advice from their own professional legal or tax advisors.
Any reference to a specific security, investment, or index is for illustrative purposes only, and it is not intended and should not be interpreted as a recommendation to purchase or sell such security, investment, or index. The trends discussed in this paper have not been independently verified by V-Square and should not be considered recommendations for action by investors. They may not be representative of V-Square’s current or future investments. V-Square has no obligation to provide any updates or changes. This information contained herein has been obtained from sources V-Square believes to be reliable, but the accuracy and completeness of such information is not guaranteed, and V-Square shall not be responsible for any inaccuracy, error, or omission from such information.
Indices and trademarks are the property of their respective owners.
All investments involve risk, including potential loss of principal invested. Past performance does not guarantee future performance. Individual client accounts may vary. The strategies and/or investments referenced herein may not be suitable for all investors as the appropriateness of a particular investment or strategy will depend on an investor’s individual circumstances and objectives. The information provided reflects the views of V-Square as of a particular time and is subject to change at any time without notice. V-Square Quantitative Management accepts no responsibility for loss arising from the use of the information contained herein.
This information is intended for educational purposes and should not be considered a recommendation to buy or sell a particular security.
The information in this document is provided in good faith without any warranty and is intended for the recipient's background information only. It does not constitute investment advice, recommendation, or an offer of any services or products for sale and is not intended to provide a sufficient basis on which to make an investment decision. It is the responsibility of any persons wishing to make a purchase to inform themselves of and observe all applicable laws and regulations.